TABLE OF CONTENTS
- Filters
- Sorting
- Columns: visibility, width, pin, and order
- Views — save your layout
- How data is displayed
- Menus
- Export
- Context menu (right-click)
- Charts
- Keyboard shortcuts
- Tools that appear only on certain dashboards
- Quick start checklist
- FAQ
- Related
Exploring AG Grid dashboards is a great next step in learning FCX Web. Most list screens are dashboards built on AG Grid — an interactive table. Once you learn the tools on one dashboard, you can use them on almost every other one.
This guide walks through the shared tools: filters, sorting, columns, views, menus, export, charts, and keyboard shortcuts. At the end you will find actions that appear only on certain dashboards.
What you see on a typical dashboard
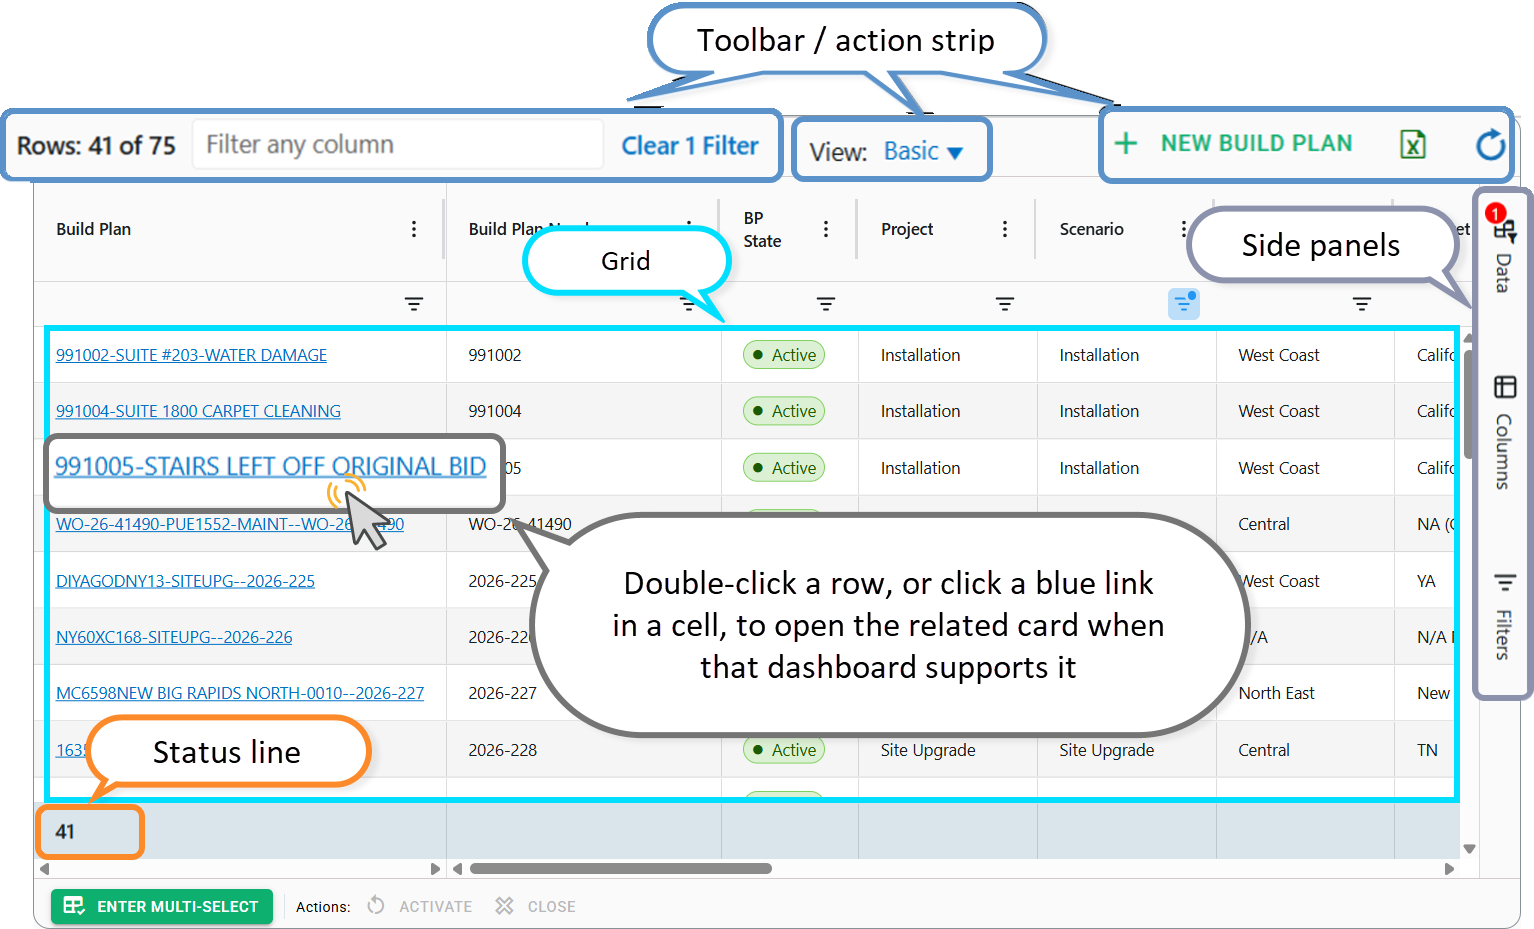
From top to bottom (layout can vary slightly):
- Toolbar / action strip — quick search, clear filters, views, domain buttons (for example New…), export, reload.
- Grid — rows and columns of data.
- Side panels (icons on the right) — Columns, Filters, and sometimes Refine Results.
- Status line — how many rows are shown (and often how many match your filters).
Double-click a row, or click a blue link in a cell, to open the related card when that dashboard supports it. Prev/next on the card follows the current sort and filter order on the screen.
Filters
Think of filters as “show me only rows that match these rules.” Several filter types work together: a row appears only if it passes all of them.
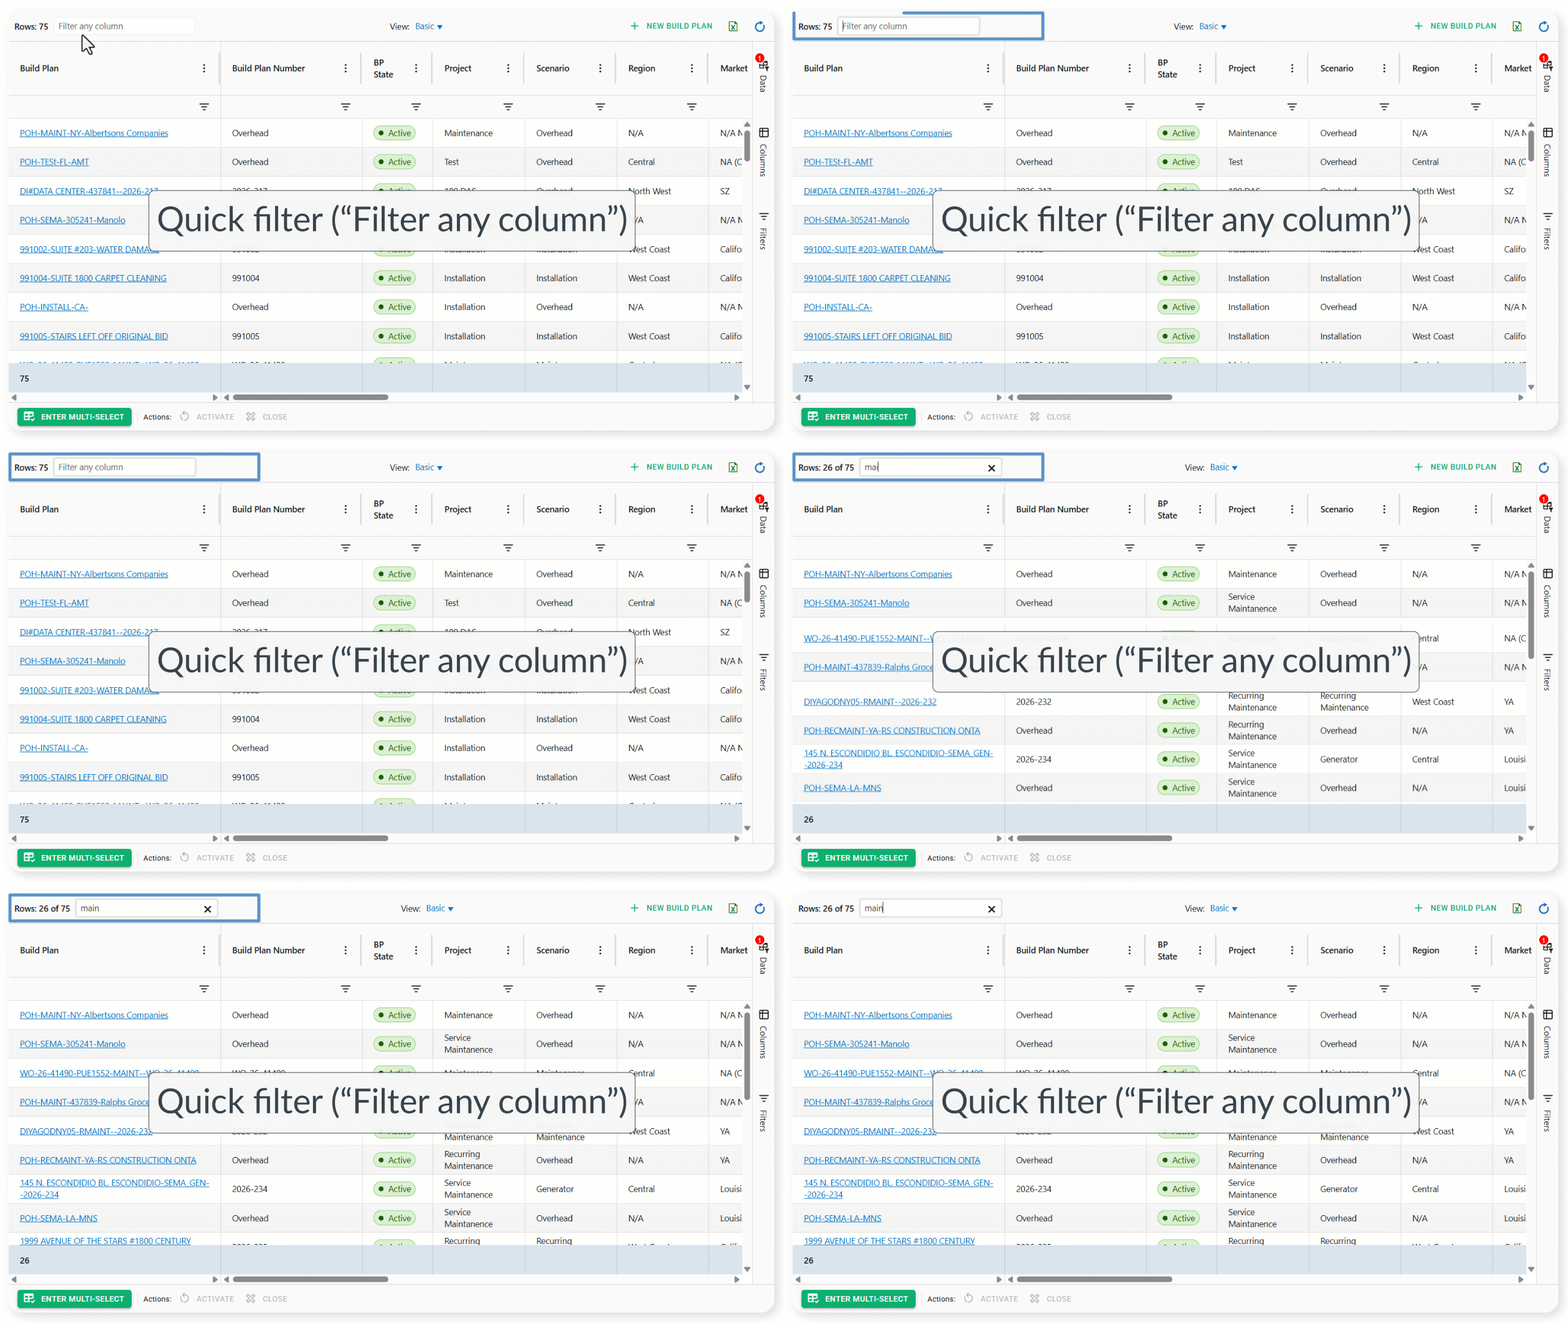
Quick filter (“Filter any column”)
Type in the search box labeled Filter any column. Fieldclix searches across many columns at once. Clear the box to remove this filter.
Column filters
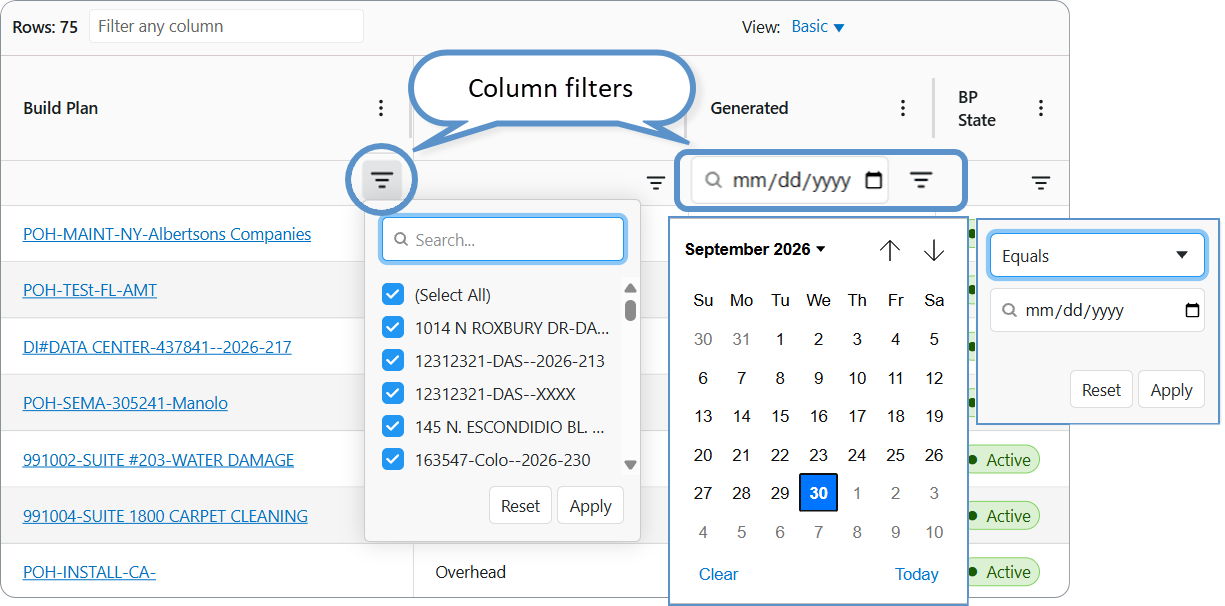
Open a filter from the column header (funnel / menu) or from the Filters side panel.
| Filter style | Best for | What you typically do |
|---|---|---|
| Text | Names, codes, free text | Contains, equals, starts with, and similar rules |
| Number | Amounts, quantities, IDs | Equals, greater than, less than, ranges |
| Date | Dates and date-times | On / before / after a date, or a date range |
| Set (checklist) | Statuses, departments, yes/no labels | Check the values you want to keep — similar to Excel |
Some columns use a combined filter (for example text + checklist). If a column has no filter icon, filtering is turned off for that field.
Clear filters
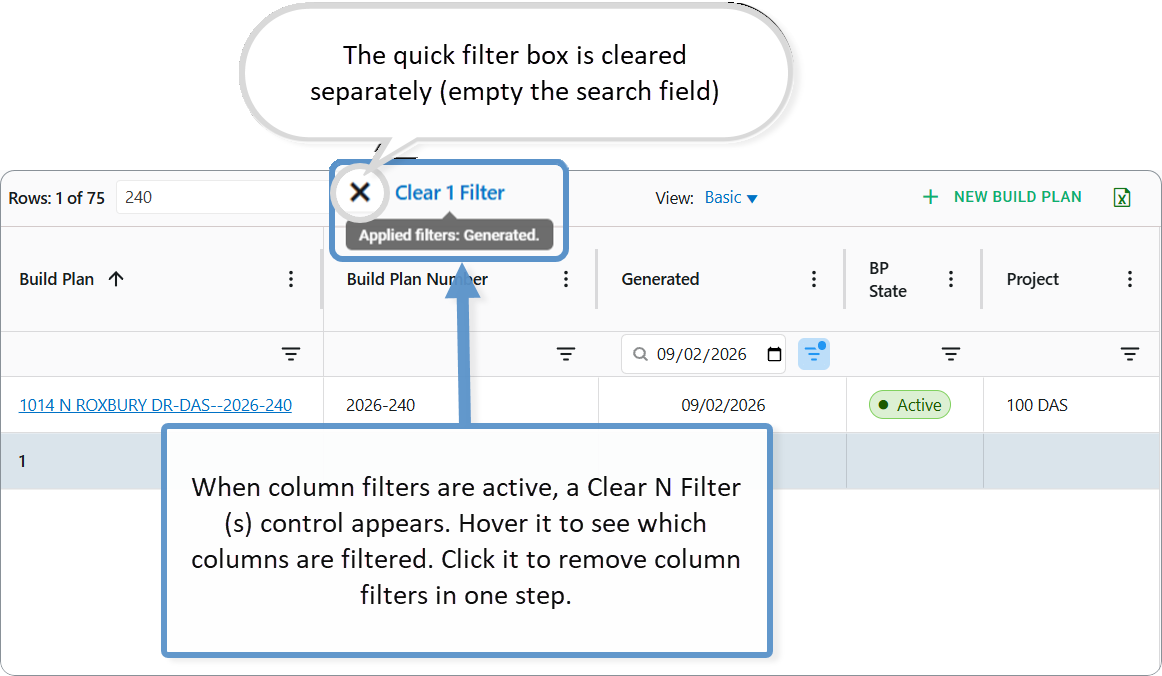
When column filters are active, a Clear N Filter(s) control appears. Hover it to see which columns are filtered. Click it to remove column filters in one step.The quick filter box is cleared separately (empty the search field).
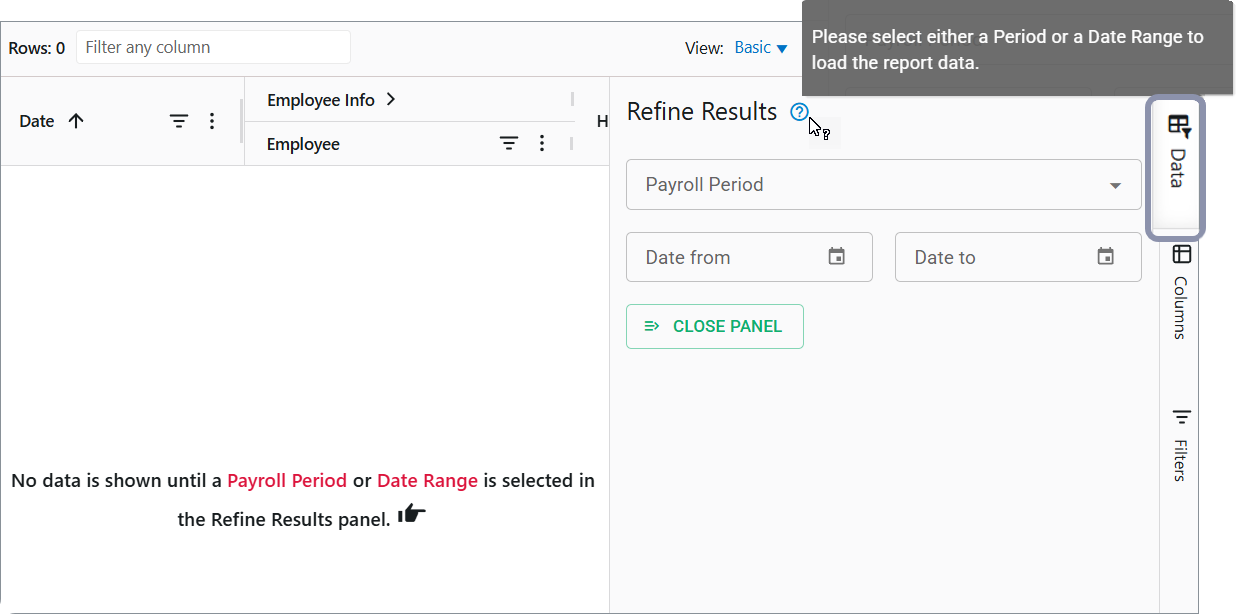
Refine Results (server filters) — not on every dashboard
Some dashboards have a side panel titled Refine Results. Those filters do more than hide rows on the screen: they tell Fieldclix which data to load.
Examples of fields you may see: date range, payroll period, Build Plan state, warehouse, notification date range.
Tip: On some reports (for example General Payroll Report), the grid stays empty until you set Refine Results. Follow the on-screen hint if no data appears.
Sorting
- Click a column header to sort ascending, then click again for descending.
- Hold Shift and click another header to add a second sort key (multi-sort).
- Clear or change sort from the column menu, or by cycling the header sort again until it resets (behavior matches AG Grid’s sort cycle).
Sorted order also drives prev/next when you open cards from the grid.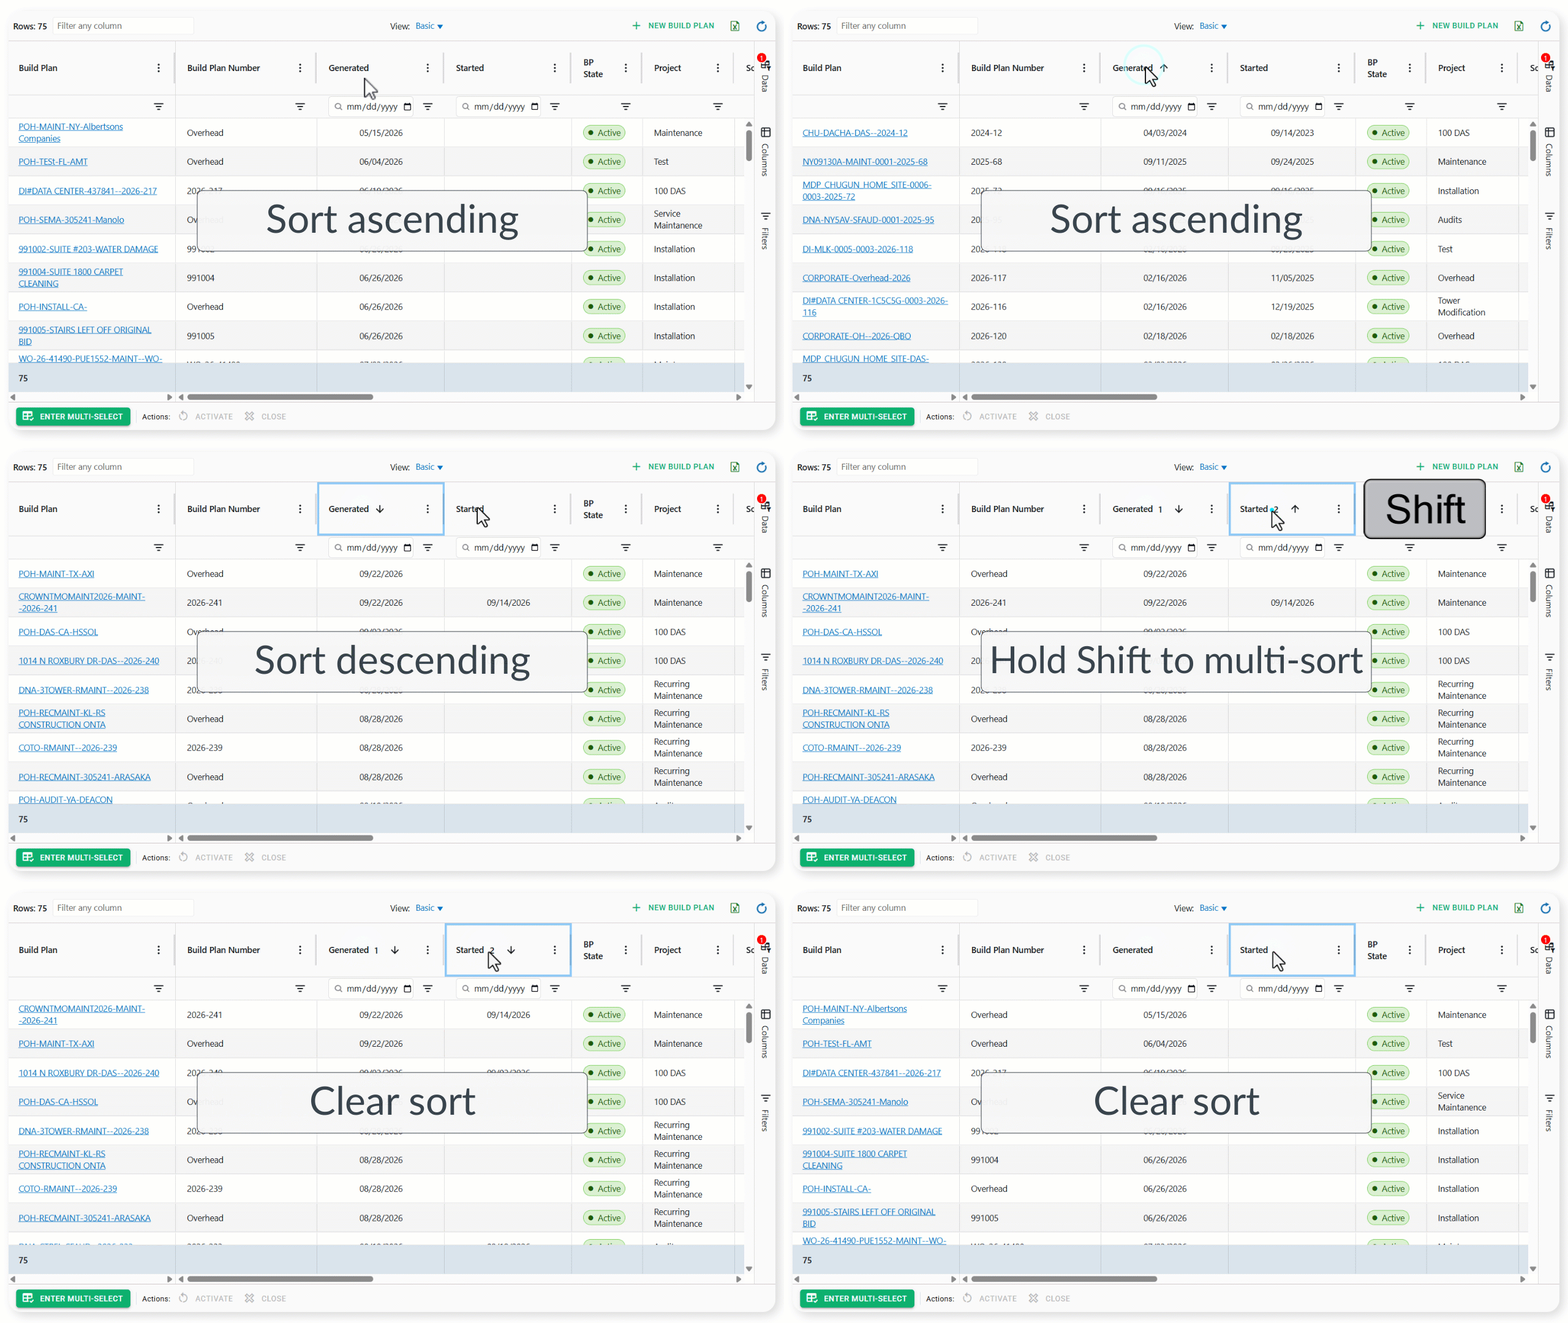
Columns: visibility, width, pin, and order
Drag and resize
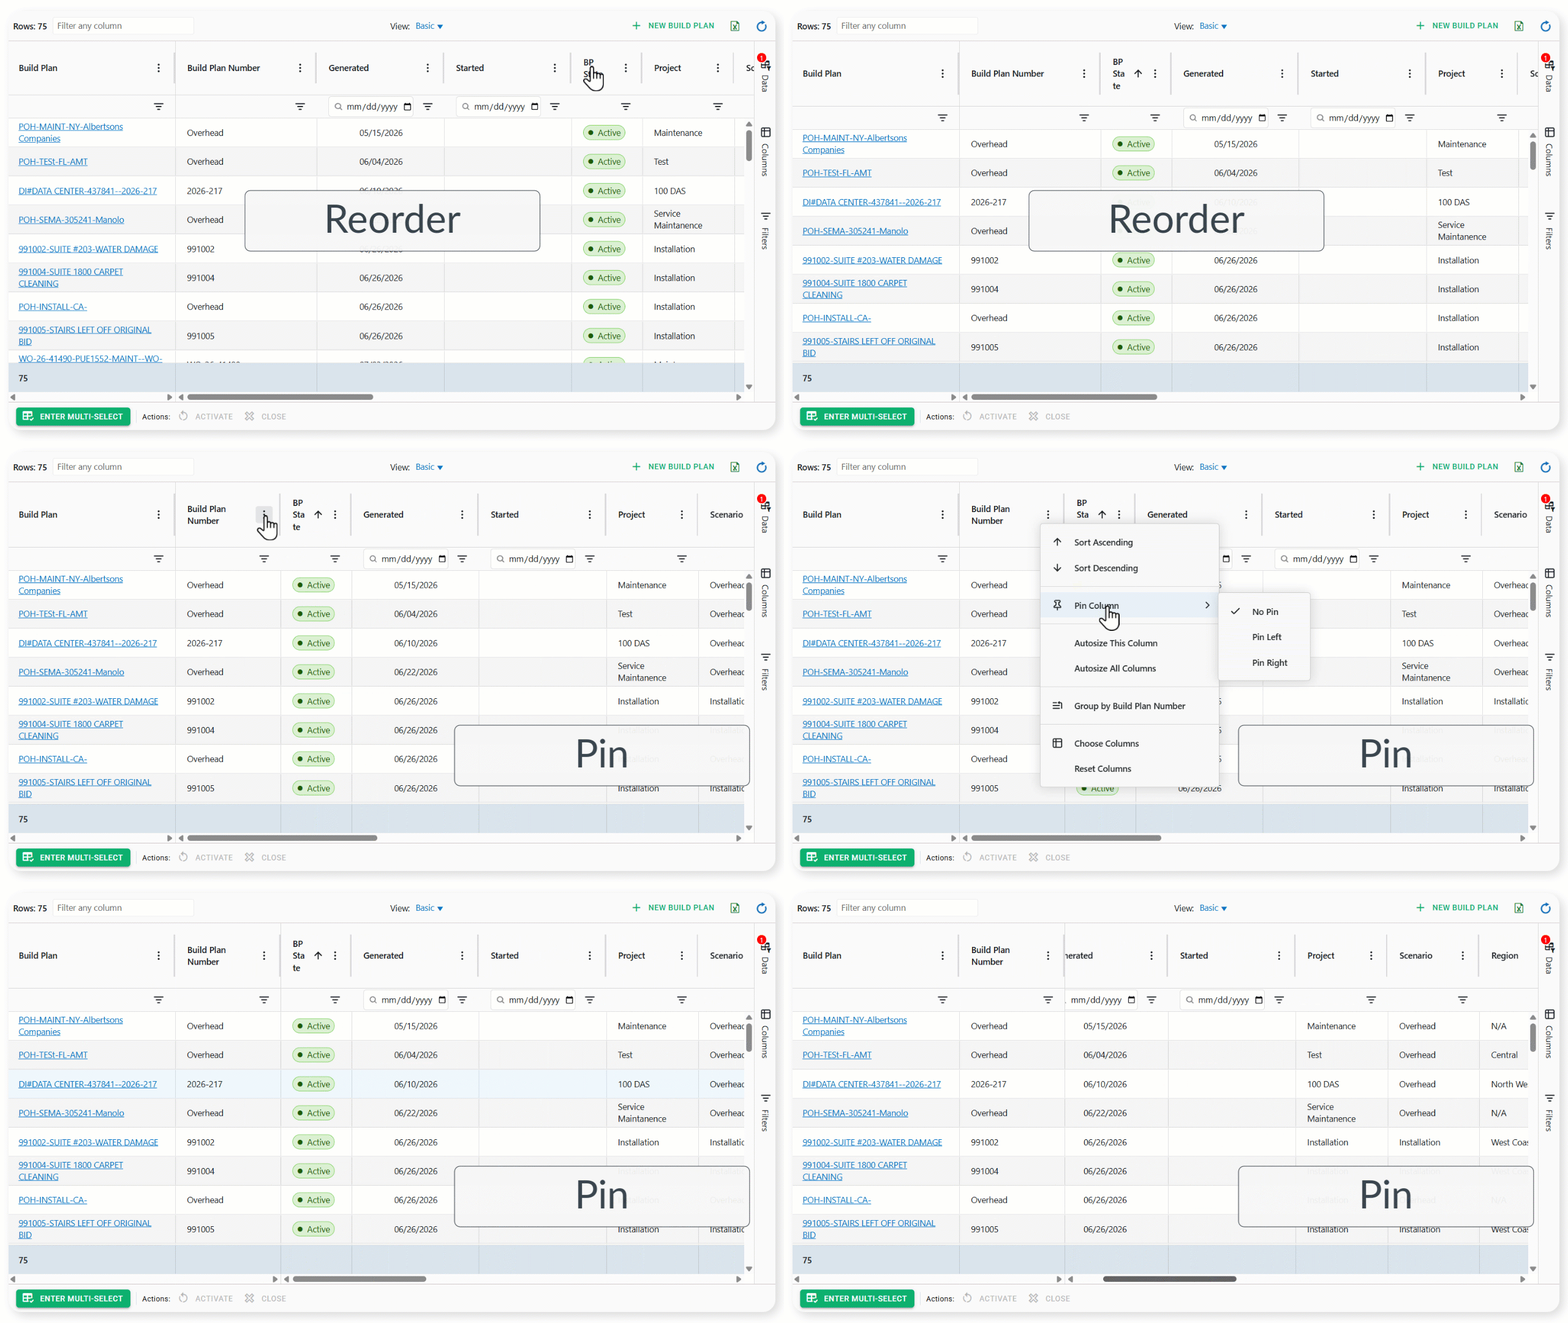
- Reorder — drag a column header left or right.
- Resize — drag the edge of a header.
- Pin — pin a column left or right from the column menu or the Columns panel so it stays visible while you scroll horizontally.
Columns side panel
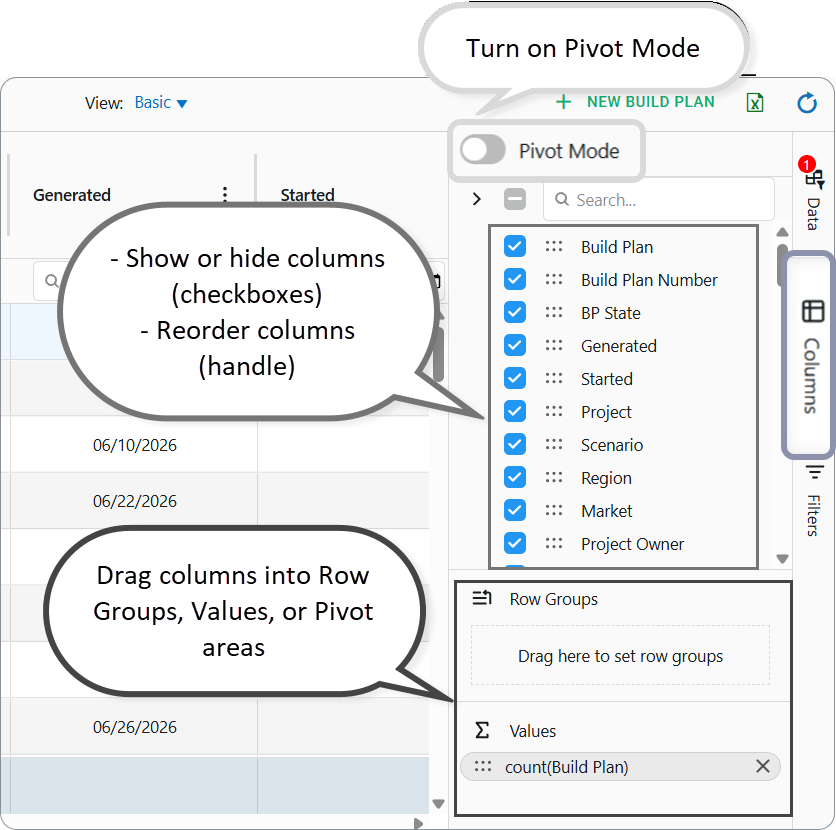
Open the Columns icon on the right. There you can:
- Show or hide columns (checkboxes).
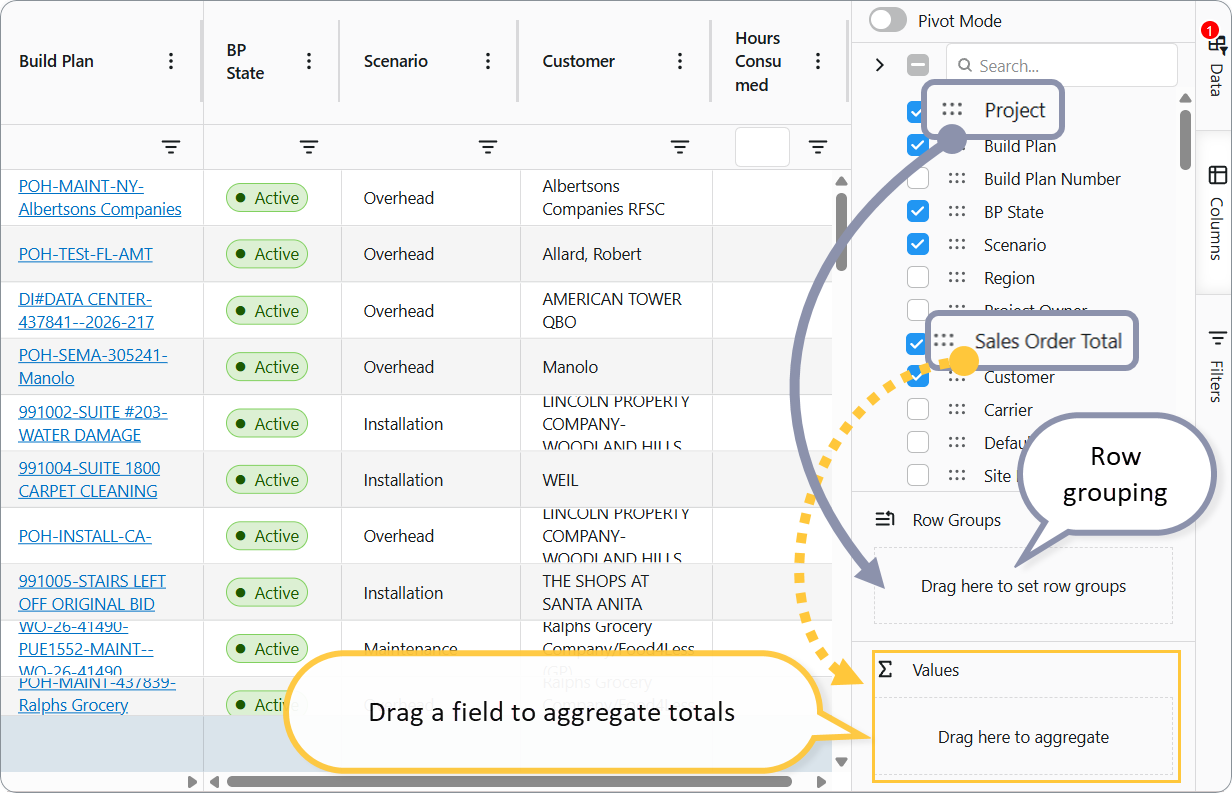
- Drag columns into Row Groups, Values, or Pivot areas when the dashboard allows grouping and pivot (useful for totals and cross-tabs).
- Reset layout by applying a View (see below).
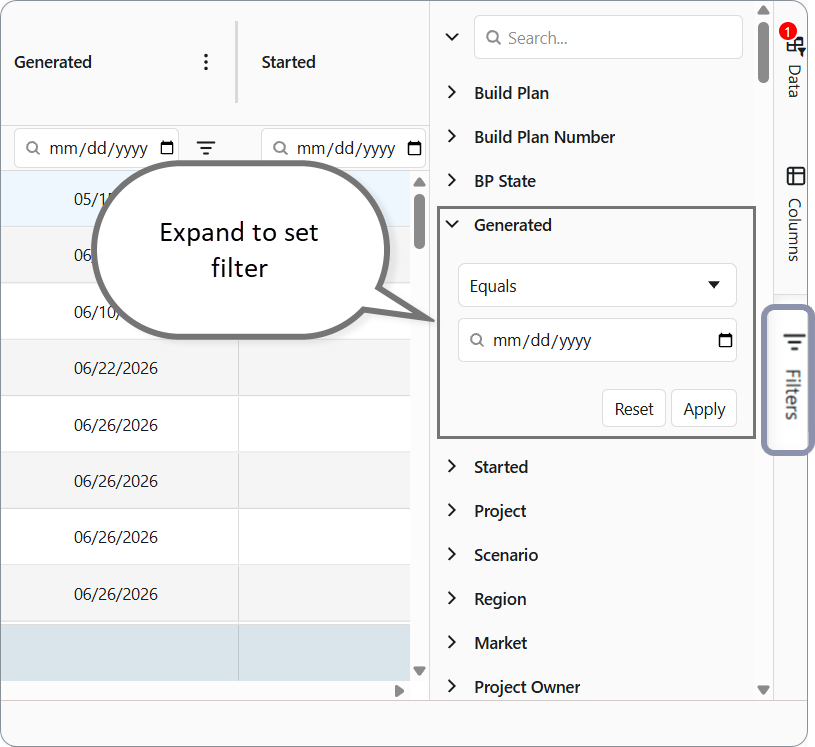
Filters side panel
The Filters panel lists all filterable columns so you can set several filters without hunting through headers.
Views — save your layout
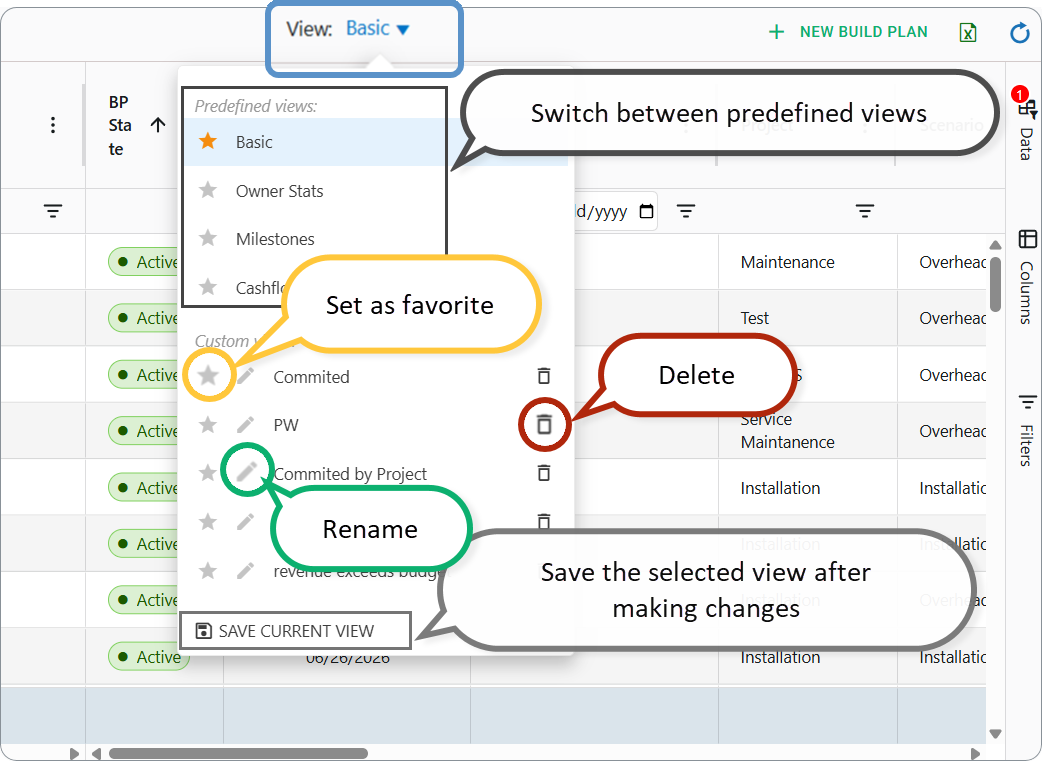
Many dashboards offer a View: control (for example View: Basic).
A view remembers things like:
- Which columns are visible, their order, width, and pins
- Applied column filters (when saved with the view)
- Grouping / pivot layout where supported
What you can do:
| Action | Result |
|---|---|
| Pick a predefined view | Apply a layout Fieldclix prepared for that screen (for example Basic, group by customer) |
| Save current view | Store your current layout as a custom view |
| Rename / update / delete | Manage custom views only (predefined views stay as shipped) |
| Set as default (favorite) | That view opens next time you return to this dashboard |
Views are personal — your custom views and favorite do not change what other users see.
How data is displayed
Beyond a flat list, many dashboards support:
- Row grouping — drag a column to the group area (or use the Columns panel) to nest rows under categories. Expand or collapse groups with the arrows or Enter when a group row is focused.
- Aggregations — totals such as sum or count on numeric / count columns when grouping or selecting cells; some screens show an aggregation area on the status line.
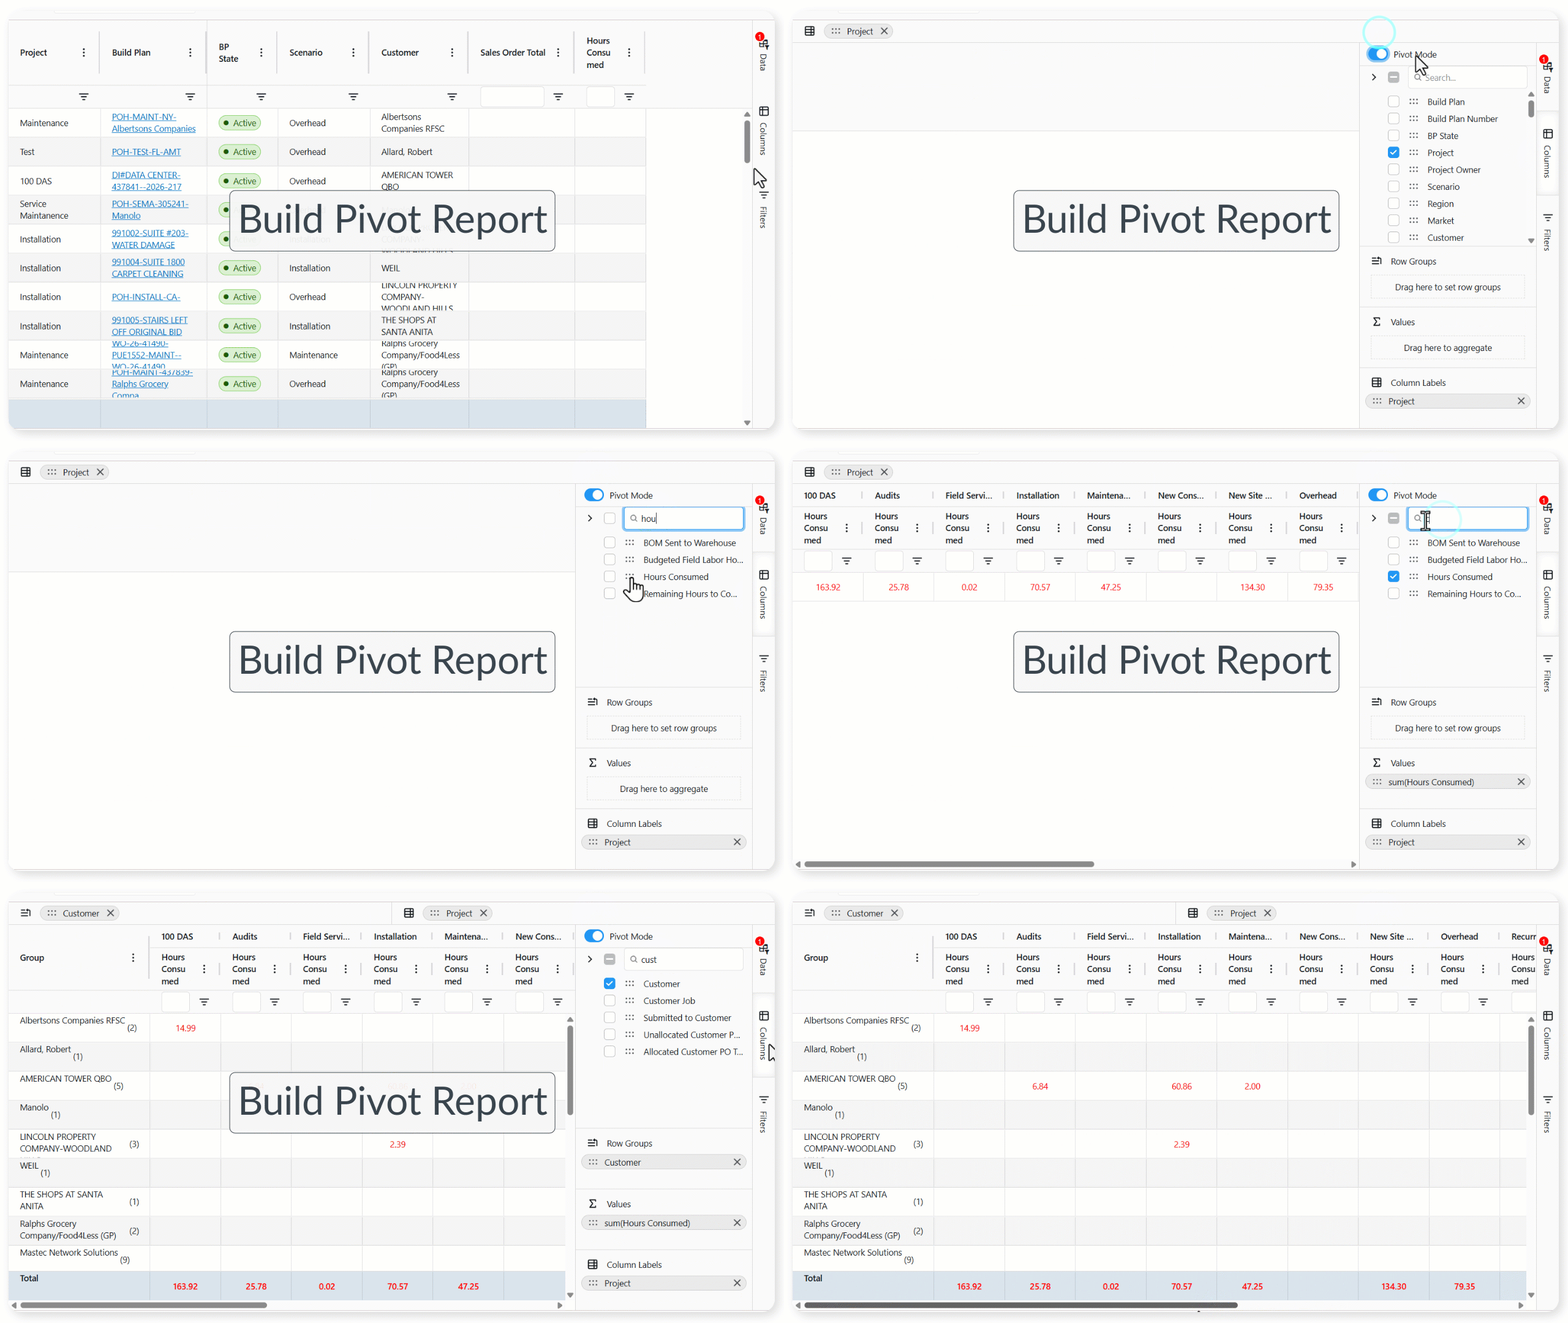
- Pivot — turn distinct values of a column into extra headers for cross-tab style analysis (when enabled on that dashboard).
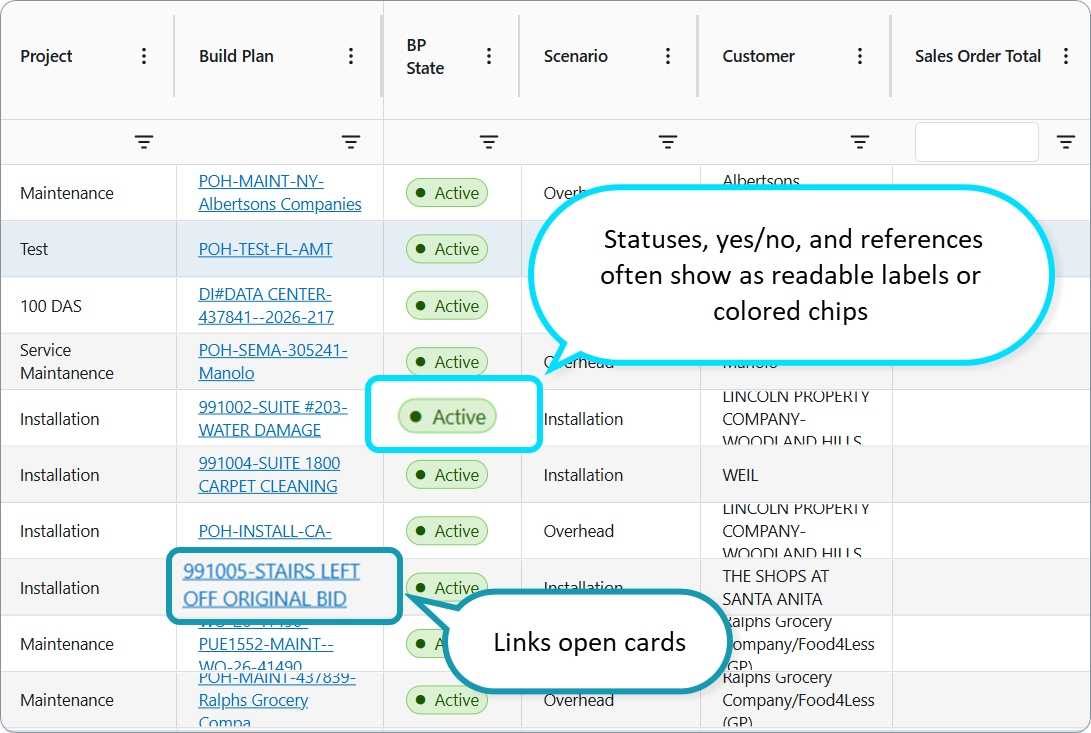
- Links and chips — statuses, yes/no, and references often show as readable labels or colored chips; links open cards.
- Row count — the status line shows total rows and how many remain after filters.
Use Reload (refresh icon) after someone else changed data, or after you finished an action that should refresh the list.
Menus
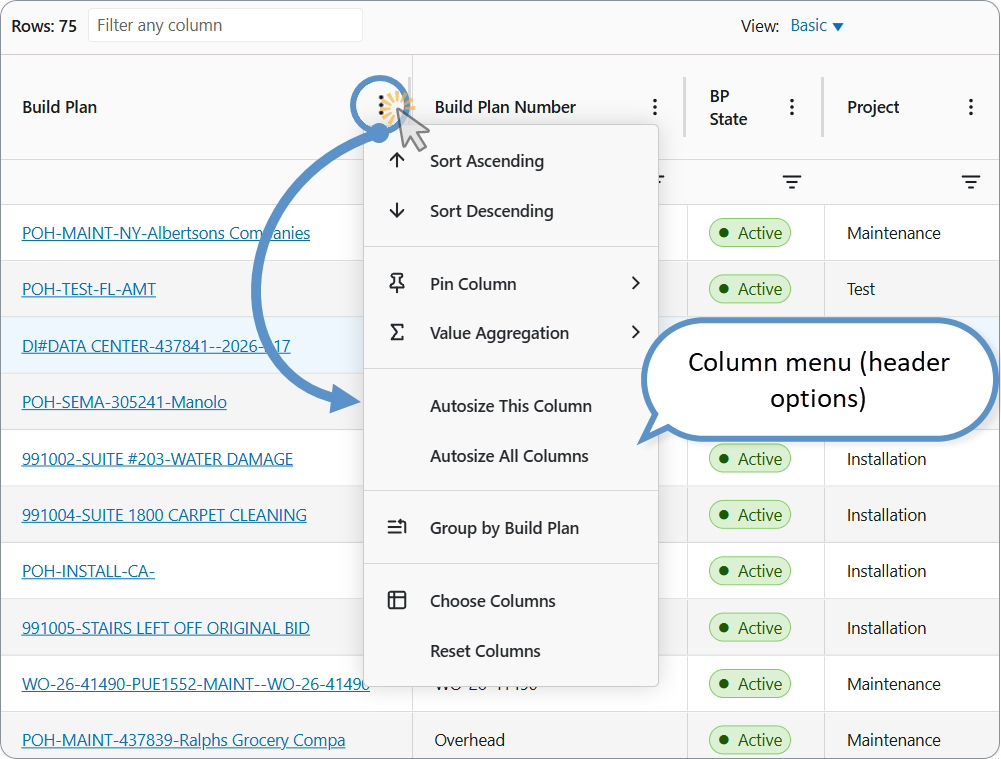
Column menu (header)
Open from the column header menu button (or keyboard — see below). Typical options:
- Pin column
- Autosize this column / autosize all
- Choose columns / reset columns (depending on the screen)
- Open the filter for that column
- Sort
Exact items follow AG Grid’s column menu for that column type.
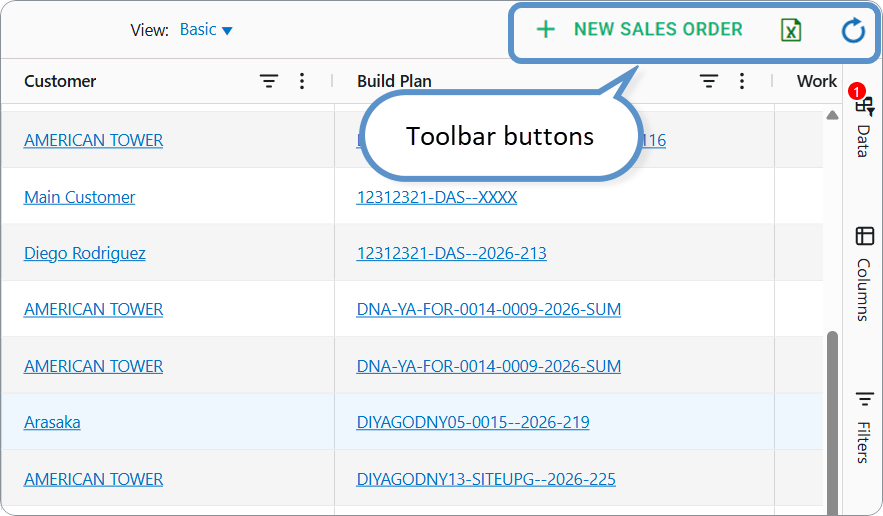
Toolbar buttons
Common shared actions:
- Export — download the current grid
- Reload — refresh data from the server
- Dashboard-specific buttons — for example create a new record, switch compact/expanded layout
Export
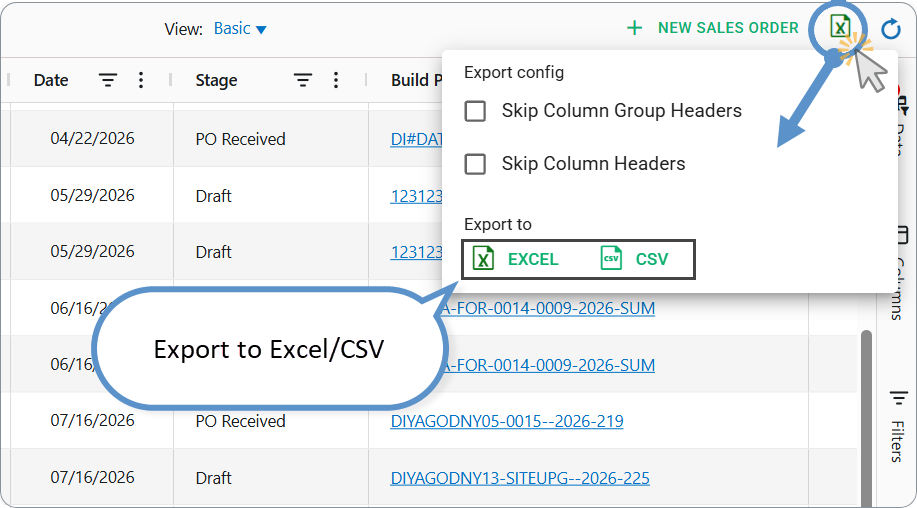
Click the Excel export control on the toolbar.
- Optionally set Skip Column Group Headers and/or Skip Column Headers.
- Choose Excel or CSV.
Export respects what you currently see: visible columns and filtered rows (as configured for that dashboard). Your skip-header preferences are remembered for next time.
You can also export from the context menu (right-click) when those AG Grid items are available.
Context menu (right-click)
Right-click a data row to open the context menu.
Shared grid actions (from AG Grid) often include:
- Copy / copy with headers
- Export
- Chart Range — build a chart from the selected cells (see Charts)
- Clipboard-related items when cell selection is enabled
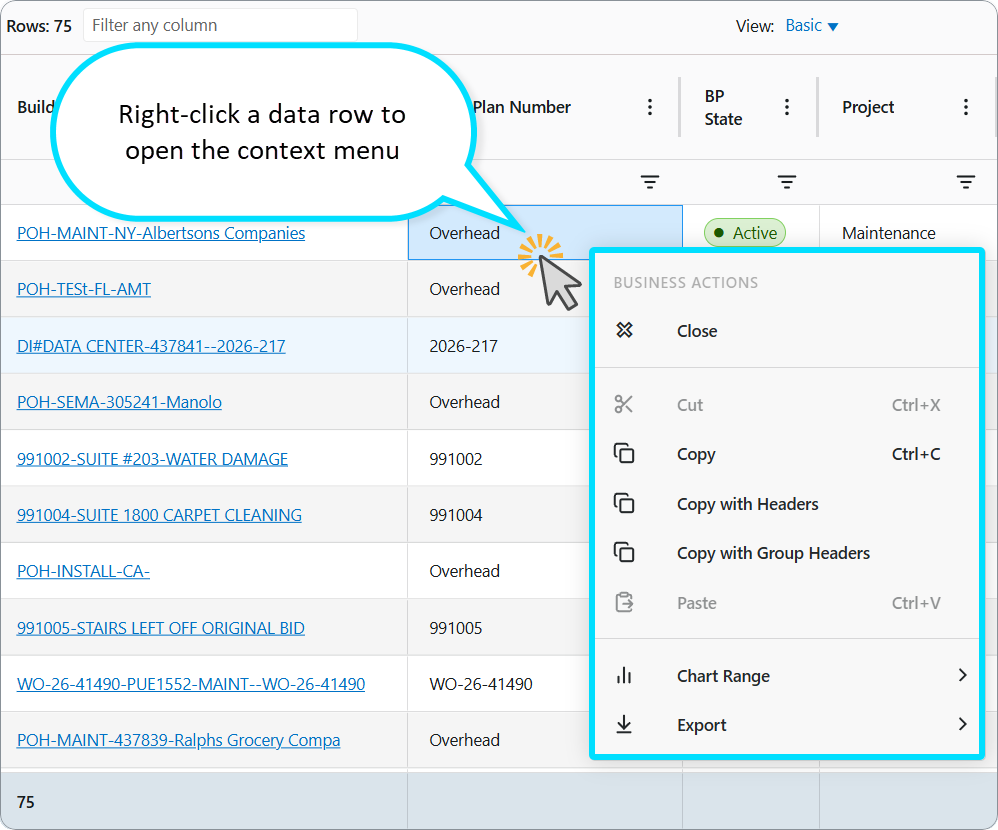
Business actions — only on some dashboards — appear above the grid actions. Examples:
| Dashboard | Examples of business actions |
|---|---|
| Build Plans | Activate, Close (with confirmation) |
| Work Orders | On hold / Release from hold, Complete, Resume, Activate, Close |
| Material Items | Copy Material Item, Add to BP, Remove from BP, Change WH Area, Return to Manufacturer; Void / Delete for warehouse managers when the item stage allows it |
If nothing happens on right-click, you may be on a group row or empty area — click a normal data row instead.
Charts
Charts are available when the dashboard allows cell selection (most list dashboards do).
- Drag across a range of cells that include categories and numbers.
- Right-click → Chart Range → pick a chart type (column, bar, line, pie, and others).
- Use the chart window menu to change type, theme, categories/series, download the chart, or unlink it from the grid.
Highlighted chart ranges in the grid show which cells feed the chart; you can adjust the range with the handles.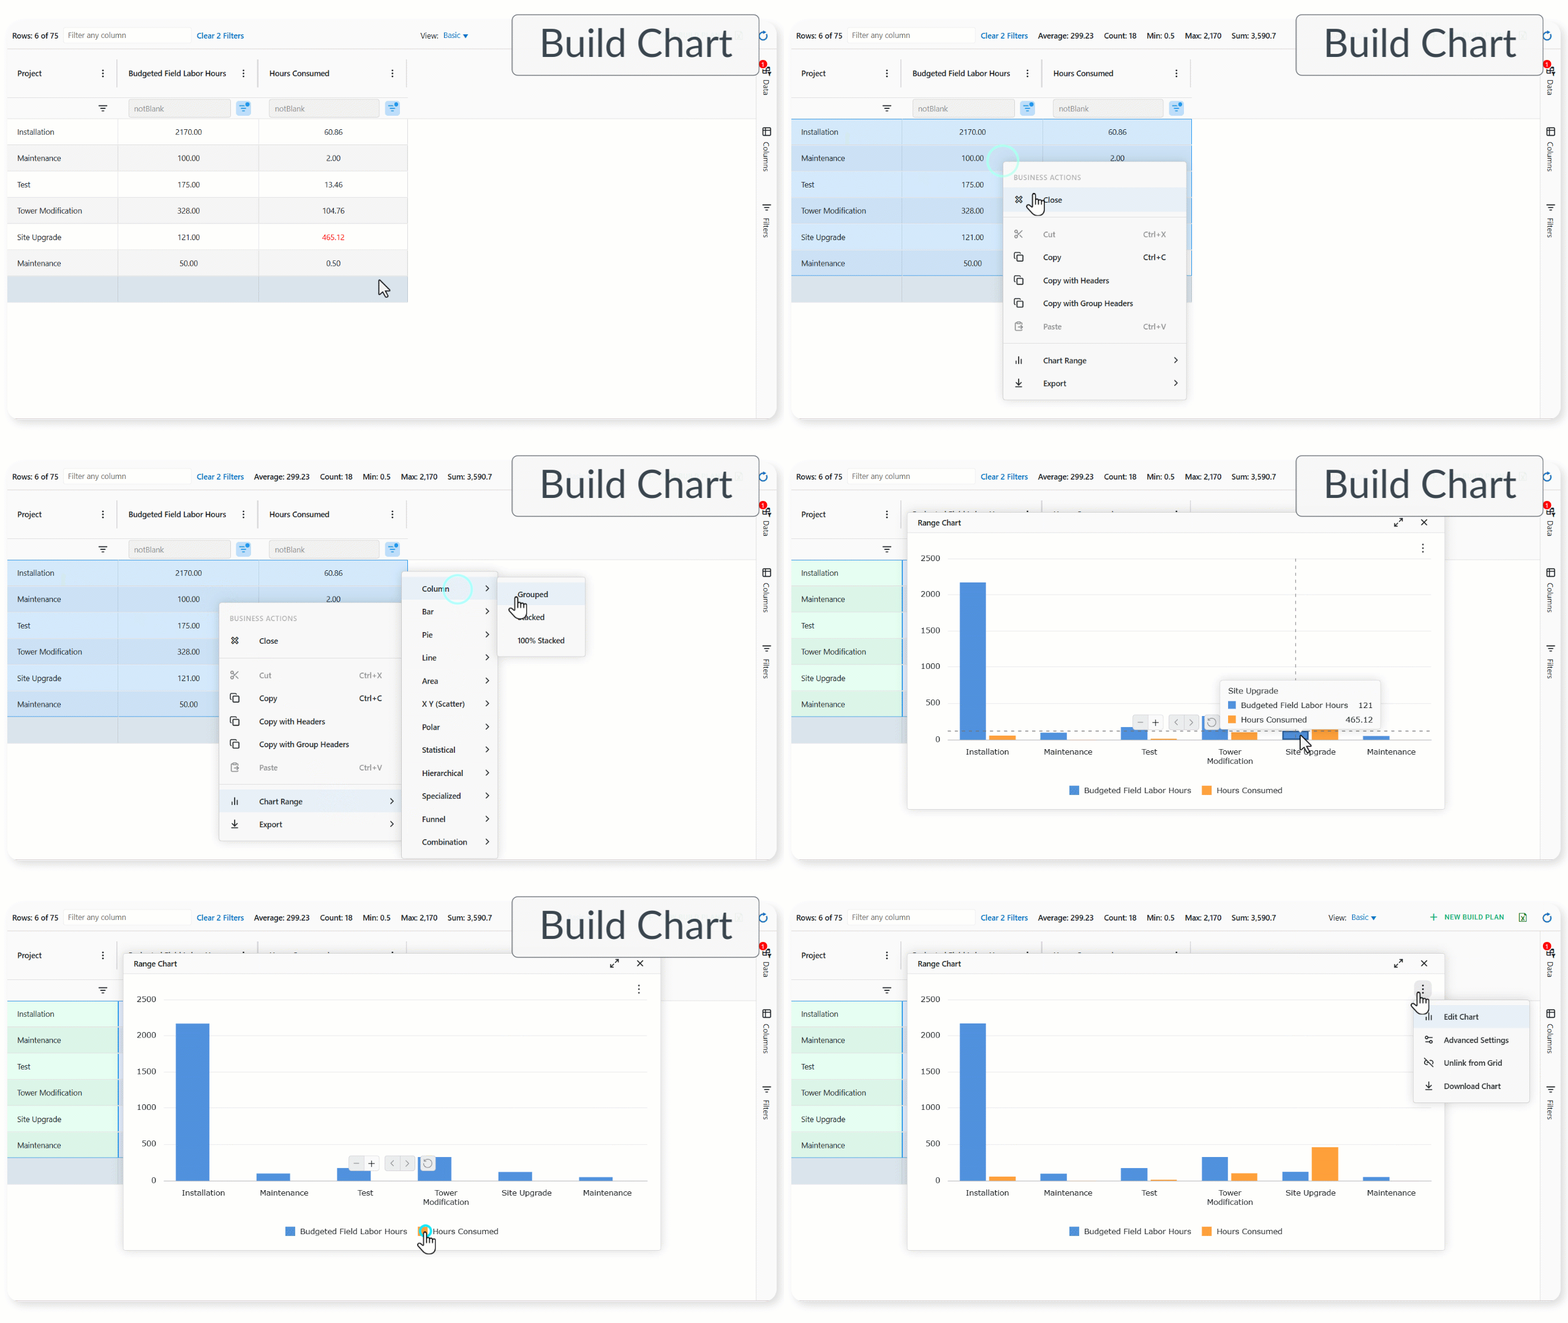
Keyboard shortcuts
Focus a cell (click it), then use:
| Keys | Action |
|---|---|
| ↑ ↓ ← → | Move between cells |
| Ctrl+← / Ctrl+→ (⌘ on Mac) | Jump to start / end of the row |
| Page Up / Page Down | Scroll by one page |
| Home / End | First / last row |
| Enter | Expand/collapse a group; open edit when editing is allowed |
| Space | Select / deselect the row |
| Ctrl+C | Copy selection (when clipboard actions are enabled) |
| Esc | Close an open menu or cancel editing |
On a column header (focus the header first):
| Keys | Action |
|---|---|
| Enter | Toggle sort |
| Shift+Enter | Multi-sort |
| Alt+↓ | Open column menu |
| Ctrl+Enter | Open filter (or menu, depending on menu style) |
| Shift+← / → | Move the column |
| Alt+← / → | Resize the column |
Full keyboard behavior is documented by AG Grid under Keyboard Interaction.
Tools that appear only on certain dashboards
These are not on every screen. If you do not see them, that dashboard simply does not use them.
| Tool | Where you may see it | What it does |
|---|---|---|
| Refine Results | Build Plans, Work Order–related lists, Time Cards with Details / Mileage, CIM Sales Orders / Purchase Orders / Invoices, General Payroll Report, VIM, Notifications, Inventory Balance / Utilization, Payroll Details, and similar | Loads a narrowed dataset from the server (dates, period, status, and so on) |
| Date range slider | Tabs inside a Payroll Period card (Time Cards, Summary, Details) | Quickly narrow visible dates inside an already open period |
| Bulk actions bar | Material Items, Build Plans (when multiple rows are selected) | Run the same action on many rows (for example Activate/Close Build Plans; Change WH Area, Add/Remove BP, Return to Manufacturer for materials) |
| Dashboard mode toggle | Work Orders dashboard | Switch compact vs expanded layout |
| Predefined views packs | Employees, Build Plans, Work Orders / Scheduler, Material Items, and others | Ready-made layouts (Basic, group by stage/customer, milestones, and so on) — names differ per screen |
| Role-gated actions | Material Items Void/Delete; General Payroll Report access | Shown only when your role allows them |
| Empty until filtered | General Payroll Report, some notification / inventory screens | No rows until Refine Results (for example date range) is set |
Always check the right-hand side panels and the toolbar on a new dashboard — that is where screen-specific tools usually live.
Quick start checklist
- Open the dashboard from the Fieldclix Web menu.
- If there is Refine Results, set dates or status first.
- Use Filter any column for a fast search, then tighten with column filters.
- Hide unused columns and pin the ones you always need.
- Save a View if you will reuse this layout.
- Export to Excel when you need a spreadsheet.
- Right-click for business actions or Chart Range when you need a visual.
FAQ
Q: Do my filters and views affect other users?
A: No. Column filters and custom views are yours. Other people keep their own layouts and favorites.
Q: Why is the grid empty?
A: Often Refine Results is required first (date range, period, and so on). Clear impossible filters, click Reload, or confirm you have access to that dashboard.
Q: What is the difference between “Filter any column” and a column filter?
A: Quick filter is one search across many columns. A column filter is a precise rule on a single field. Both can be active at the same time.
Q: Can I undo a wrong export setting?
A: Open Export again and change Skip Column Headers / Skip Column Group Headers. Preferences are stored for your browser profile.
Q: Why don’t I see Activate / Close / Void in the context menu?
A: Those items are dashboard- and role-specific, and they hide when the row state does not allow the action (for example already closed, or wrong material stage).
Q: Charts menu is missing.
A: Select a cell range that includes numeric data, then right-click. If the dashboard disables cell selection, Chart Range will not appear.
Q: Where can I learn more about the grid itself?
A: Fieldclix embeds AG Grid. Official topics that match this article: Filtering, Column Menu, User Created Charts, Keyboard Interaction.
Related
- Module-specific dashboard articles in your Freshdesk folder (Build Plans, Work Orders, Time Cards, Inventory, and so on) — they describe business columns and workflows; this article covers the shared grid tools.
- Glossary: "Fieldclix Speak"
Was this article helpful?
That’s Great!
Thank you for your feedback
Sorry! We couldn't be helpful
Thank you for your feedback
Feedback sent
We appreciate your effort and will try to fix the article