TABLE OF CONTENTS
The Budgets Dashboard lets you compare Build Plan budgets across many projects at once. Use it to monitor performance, spot variances, and drill into the same budget grid you see on a single Build Plan's Budget tab.
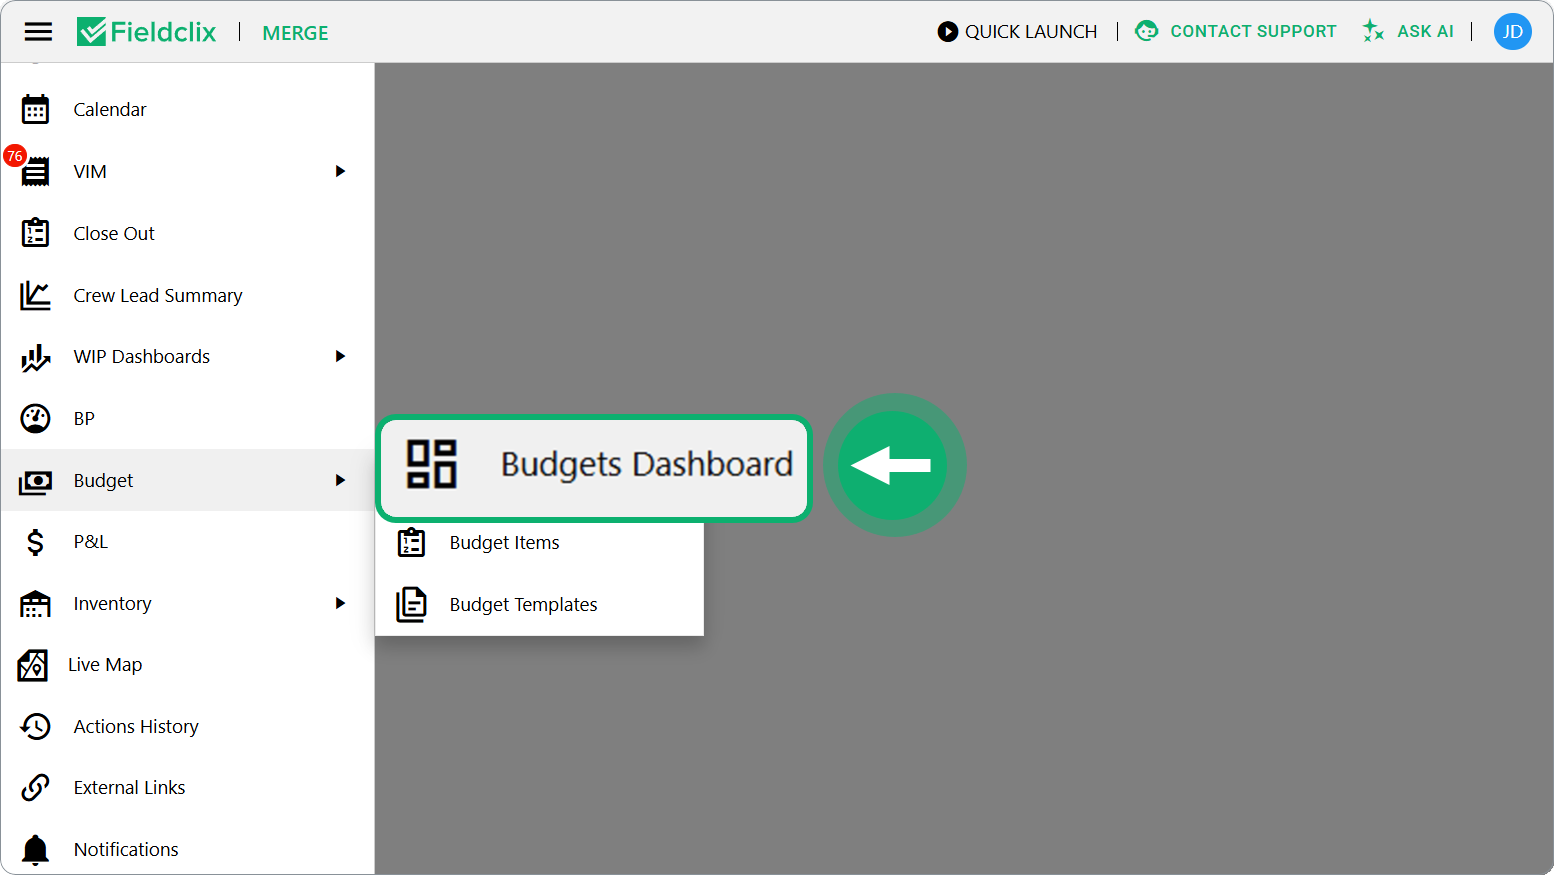
Open it from the main menu: Budget → Budgets Dashboard.
Who can access the dashboard
The Budgets Dashboard is available to employees with the Financial employee role (and administrators).
You see only Build Plans you have financial access to—the same rules as on the Build Plan Budget tab, Status, WIP, and P&L. If a Build Plan is outside your scope, it does not appear on Details and does not contribute to Summary totals.
For the full access matrix (Budget Items, Templates, budget actions, Advanced Budget Manager approve bypass), see Build Plan Budgets — Who can work with budgets.
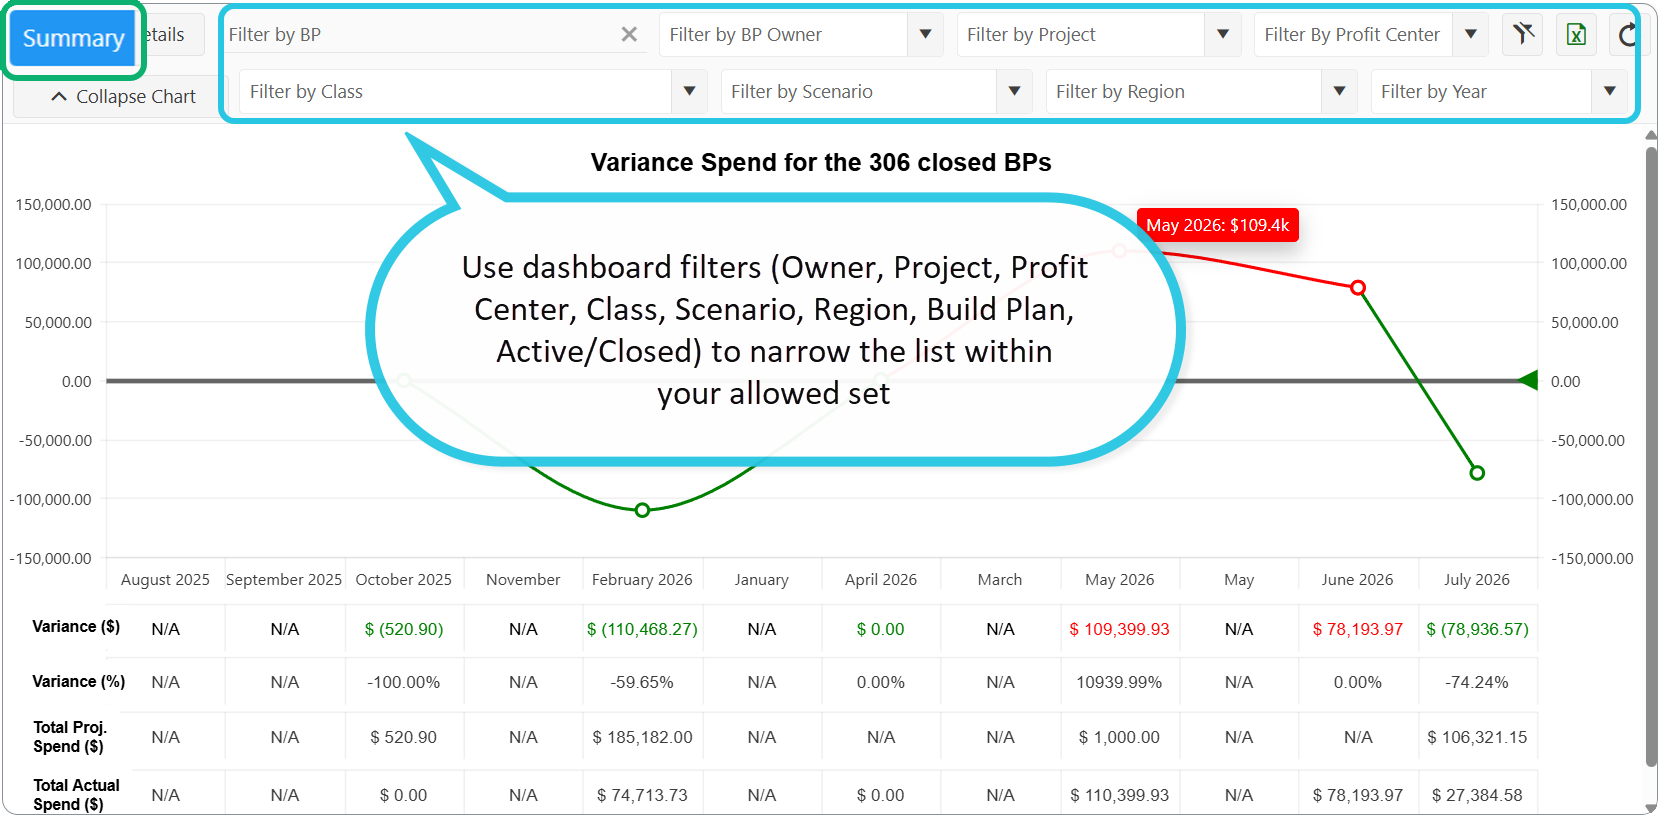
Use dashboard filters (Owner, Project, Profit Center, Class, Scenario, Region, Build Plan, Active/Closed) to narrow the list within your allowed set.
Dashboard tabs
| Tab | Purpose |
|---|---|
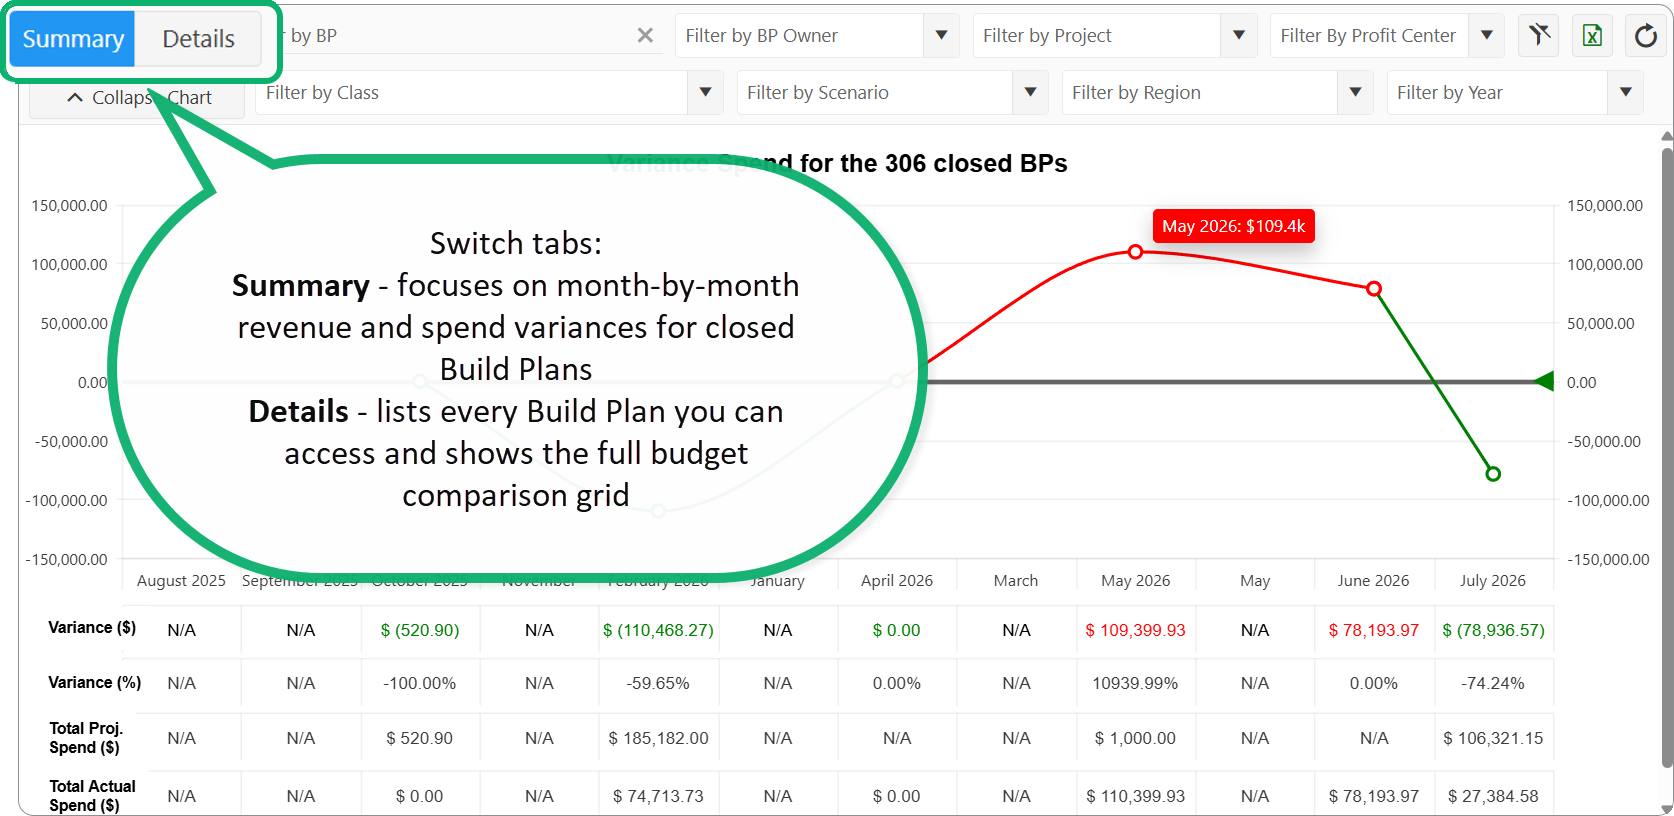
| Summary | Month-by-month revenue and spend variances for closed Build Plans (default: last 12 months through the 1st of the current month) |
| Details | Full budget grid per Build Plan—the same sections as Current Budget on the Build Plan tab |
Switch tabs with the toolbar at the top of the dashboard.
Summary Tab
The Summary tab focuses on closed Build Plans over a selected time window.
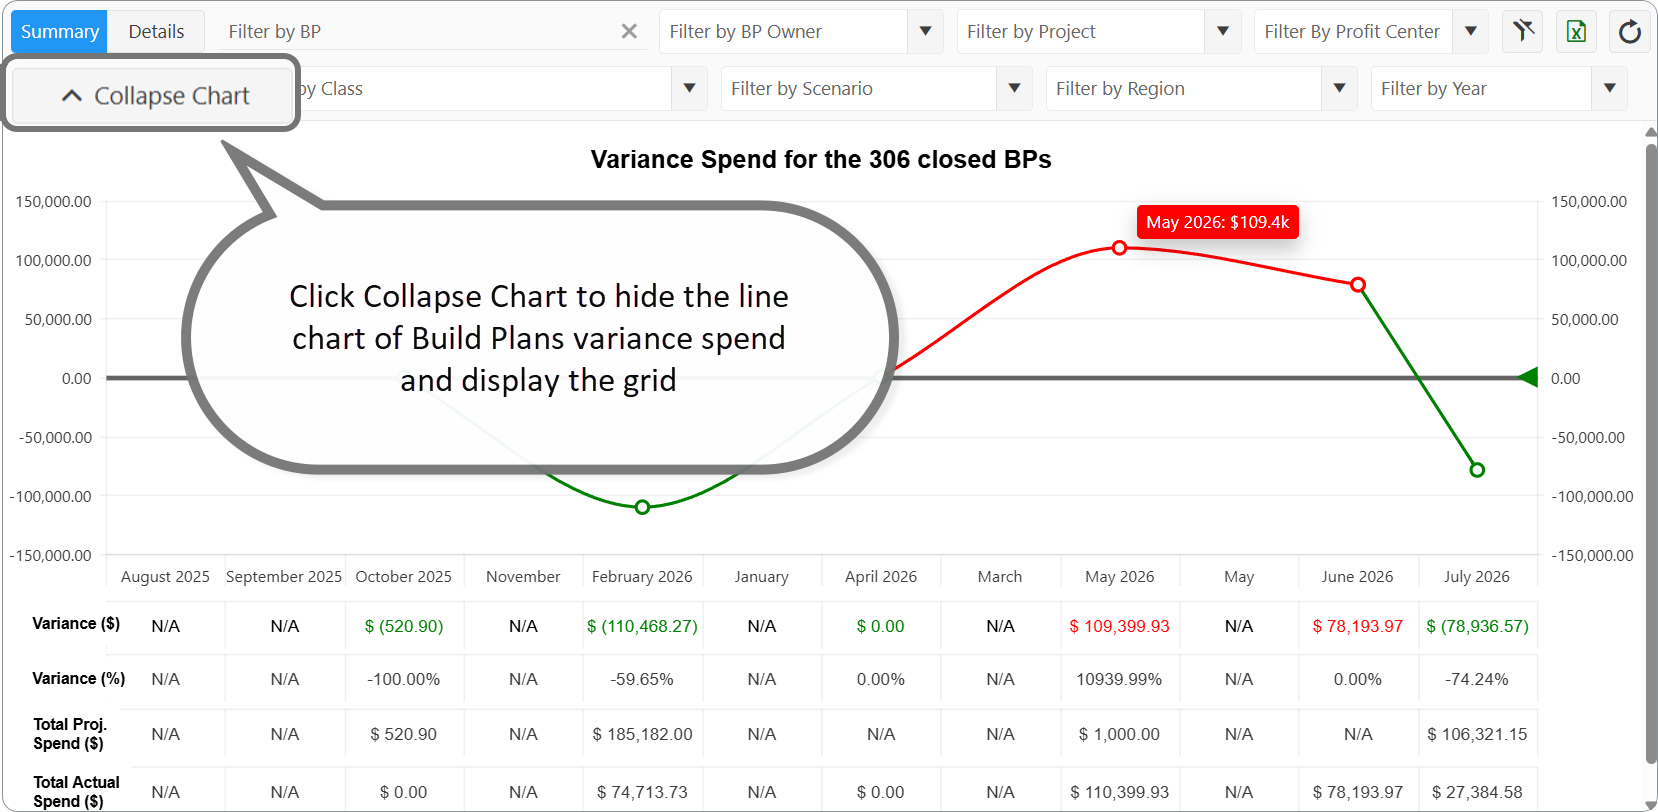
Click Collapse Chart to hide the line chart of Build Plans variance spend and display the grid.
Default date range
- Last 12 months ending on the 1st day of the current month
- Change the Year filter to view a different period
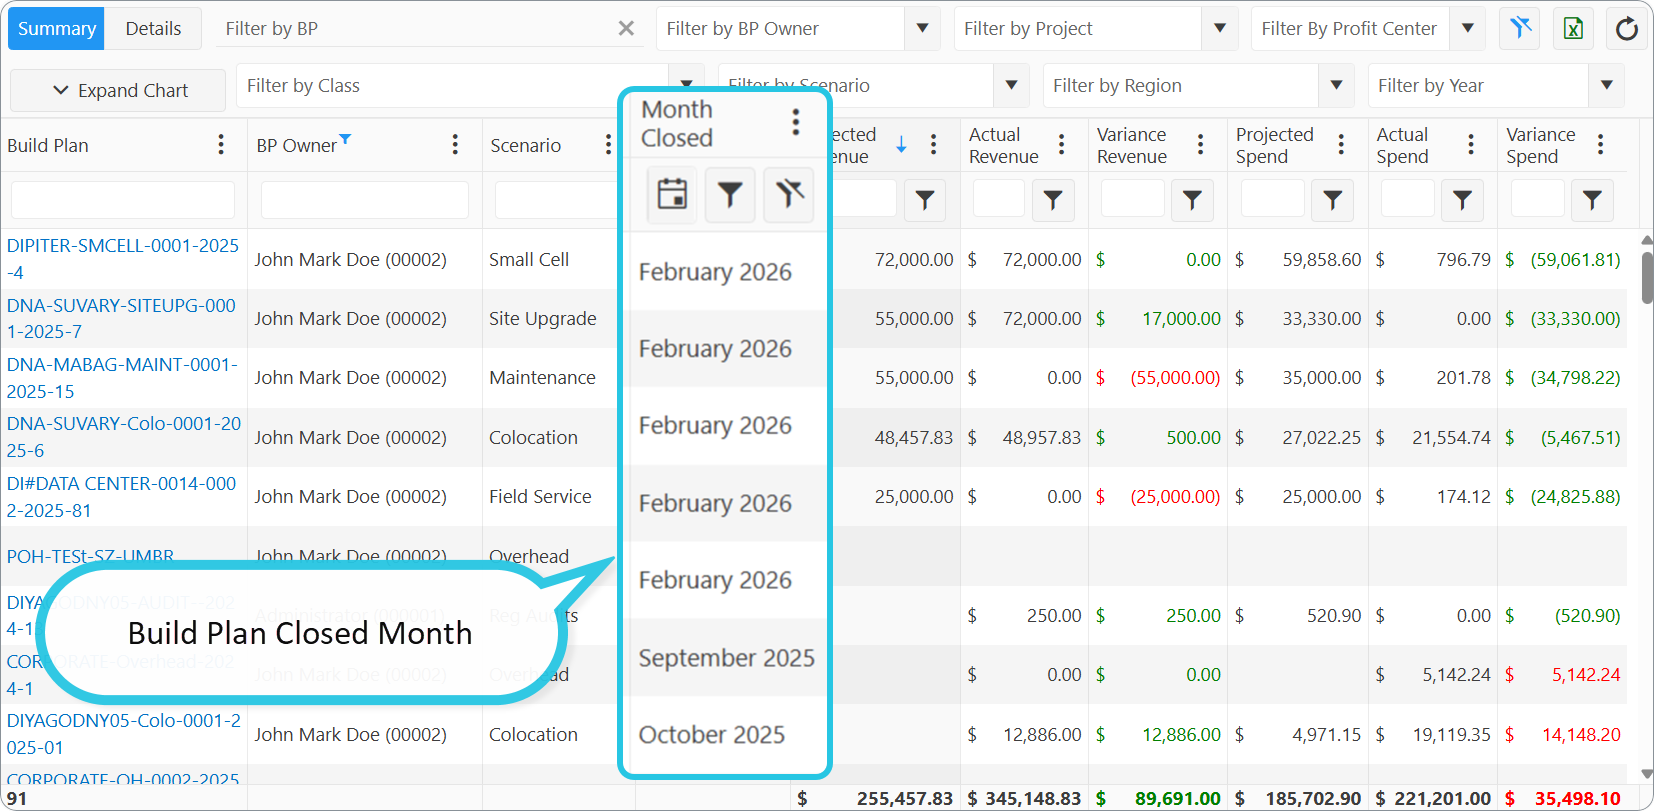
Revenue table
| Column | Definition |
|---|---|
| Projected Revenue | Planned Revenue from the Build Plan budget for months in the selected period |
| Actual Revenue | Total customer invoice (CIM) financial distributions for those months |
| Variance Revenue | Actual Revenue − Projected Revenue |
Positive variance revenue means you billed more than planned for that month; negative means less.
Spend table
| Column | Definition |
|---|---|
| Projected Spend | Planned expenses from the Build Plan budget (direct COGS + pass-through COGS) for the period |
| Actual Spend | Expense financial distributions (Time Keeping, BOM, COD, VIM invoices) for the period |
| Variance Spend | Actual Spend − Projected Spend |
Positive variance spend means you spent more than planned; negative means less.
Chart and totals row
The chart plots Variance Spend by month (sum of per-Build Plan variances in the filtered set).
Click on a dot on the chart to filter the grid data by month of Build Plan closure.
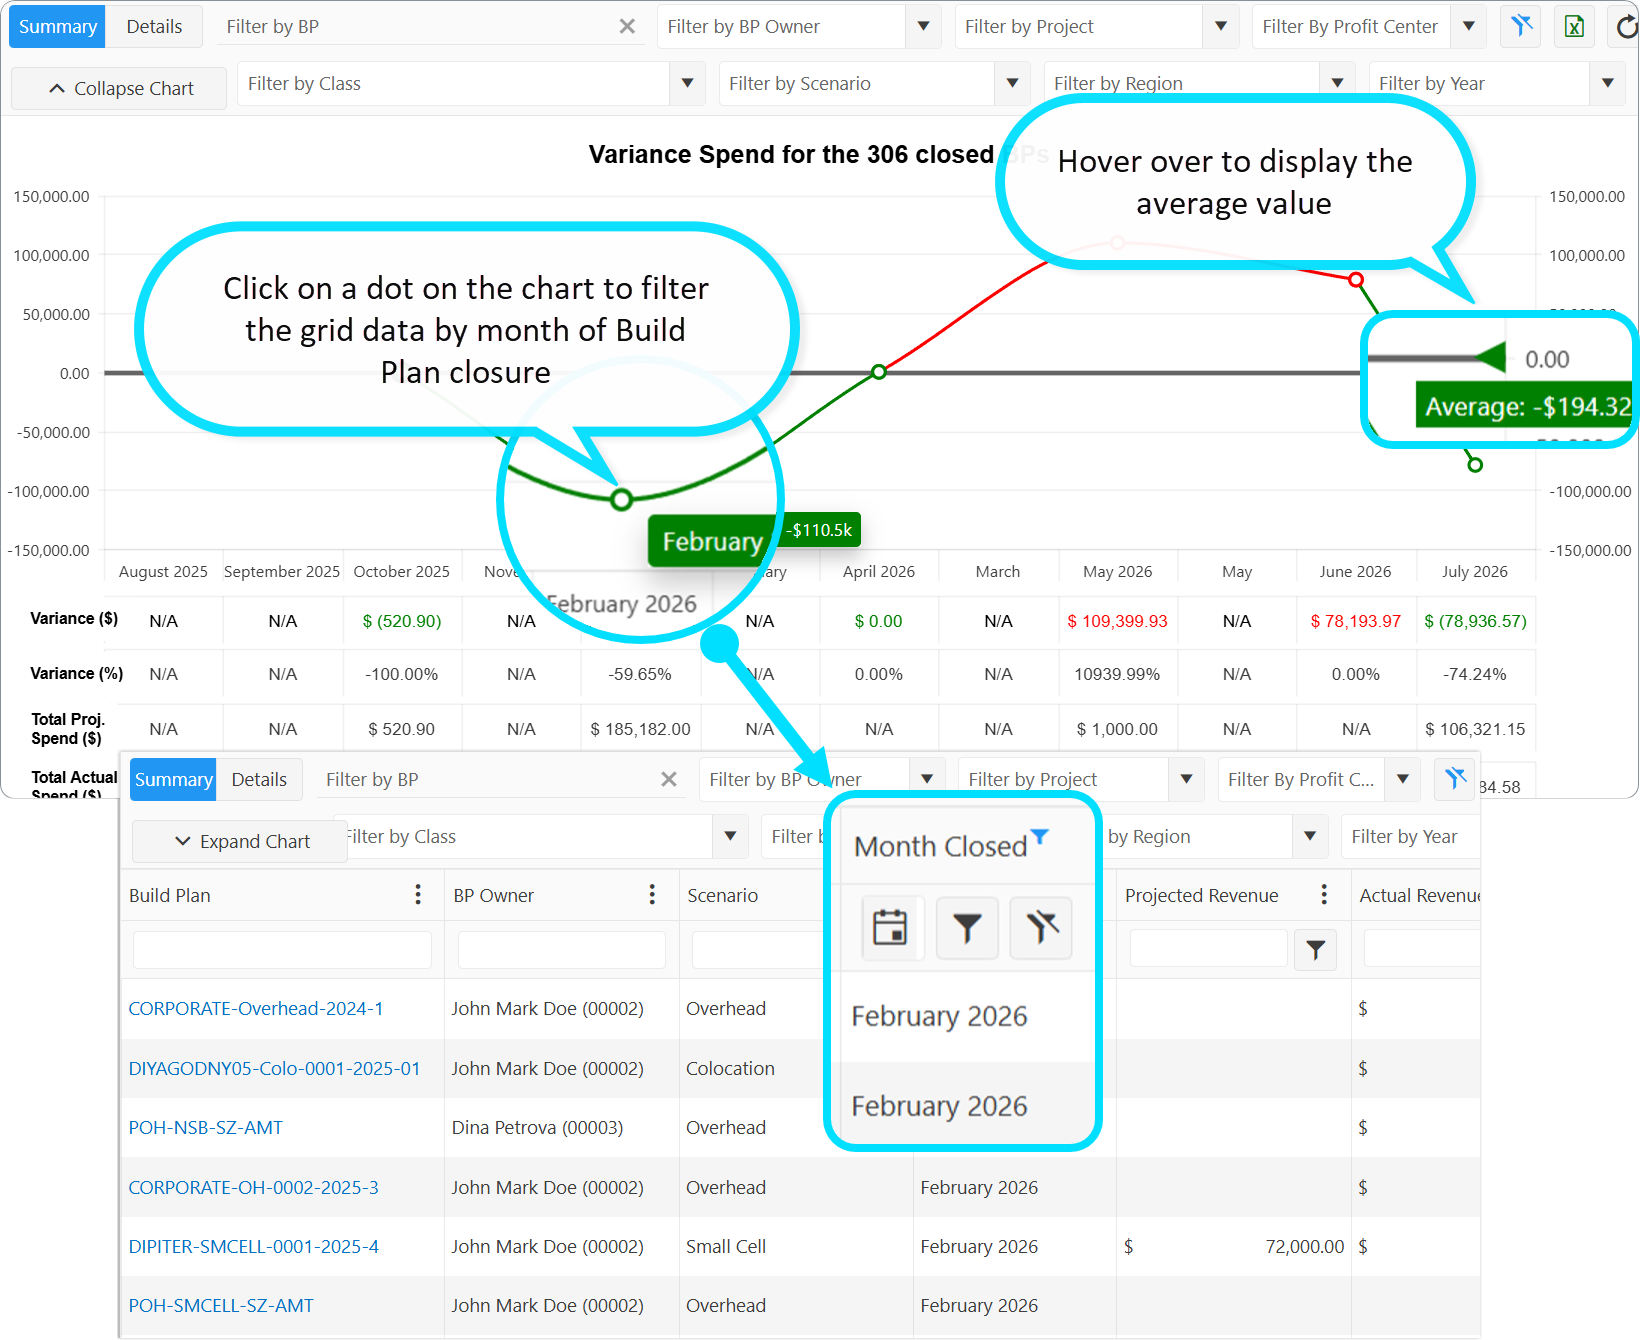
Footer totals for the selected period:
| Metric | Formula |
|---|---|
| Total Projected Spend ($) | Sum of Projected Spend |
| Total Actual Spend ($) | Sum of Actual Spend |
| Variance ($) | Total Actual Spend − Total Projected Spend |
| Variance (%) | Variance ($) ÷ Total Projected Spend ($)× 100 |
If Total Projected Spend is zero, variance percent is shown as 0%.
Configurable (your instance)
Which Build Plans count as "closed" for Summary and which financial accounts feed Actual Spend depend on your financial period close process and account setup.
Details Tab
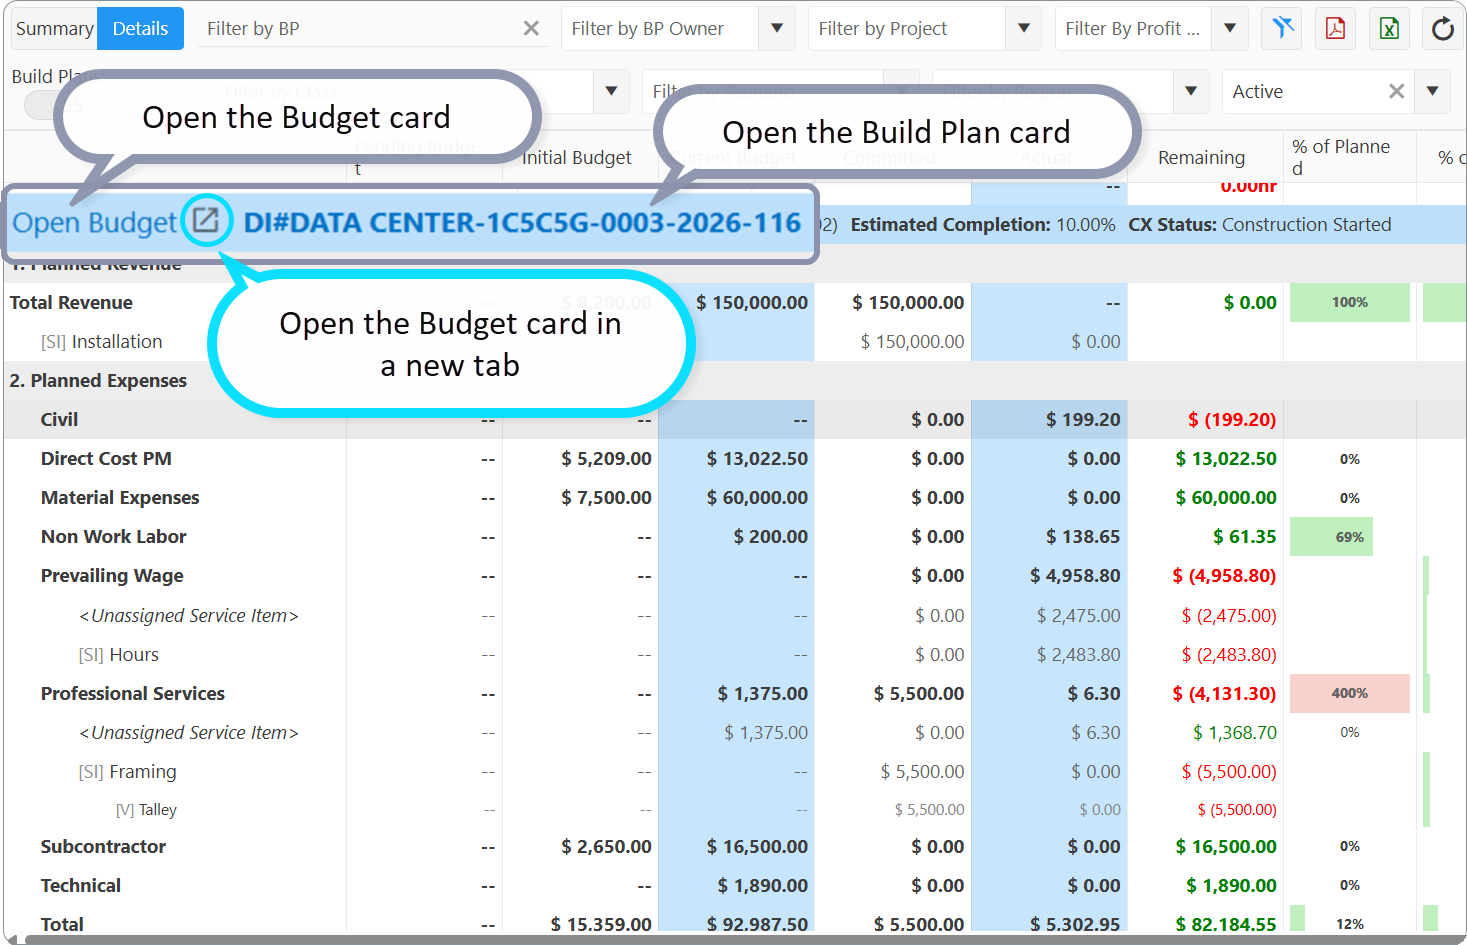
The Details tab lists every Build Plan you can access and shows the full budget comparison grid:
- Planned Revenue
- Planned Expenses (with optional [SI] and [V] breakdown)
- Totals (including Current WIP and Adjusted P&L)
- Profit Margins
- Labor Hours
Column definitions match Monitor Build Plan Budget.
Click a Build Plan row to open its card. Use Open Budget from the Build Plan Budget tab to edit the pending revision or revise the approved budget.
Configurable (your instance)
Service Item and Vendor sub-rows appear when your budgets or transactions use those fields. Pass-through accounts and Disable Pass Through affect margin sections the same way as on the Build Plan Budget tab.
Configurable (your instance)
When UseEasyBudget is on, section 1 is labeled Labor Cost ($) instead of Planned Revenue.
Export and print
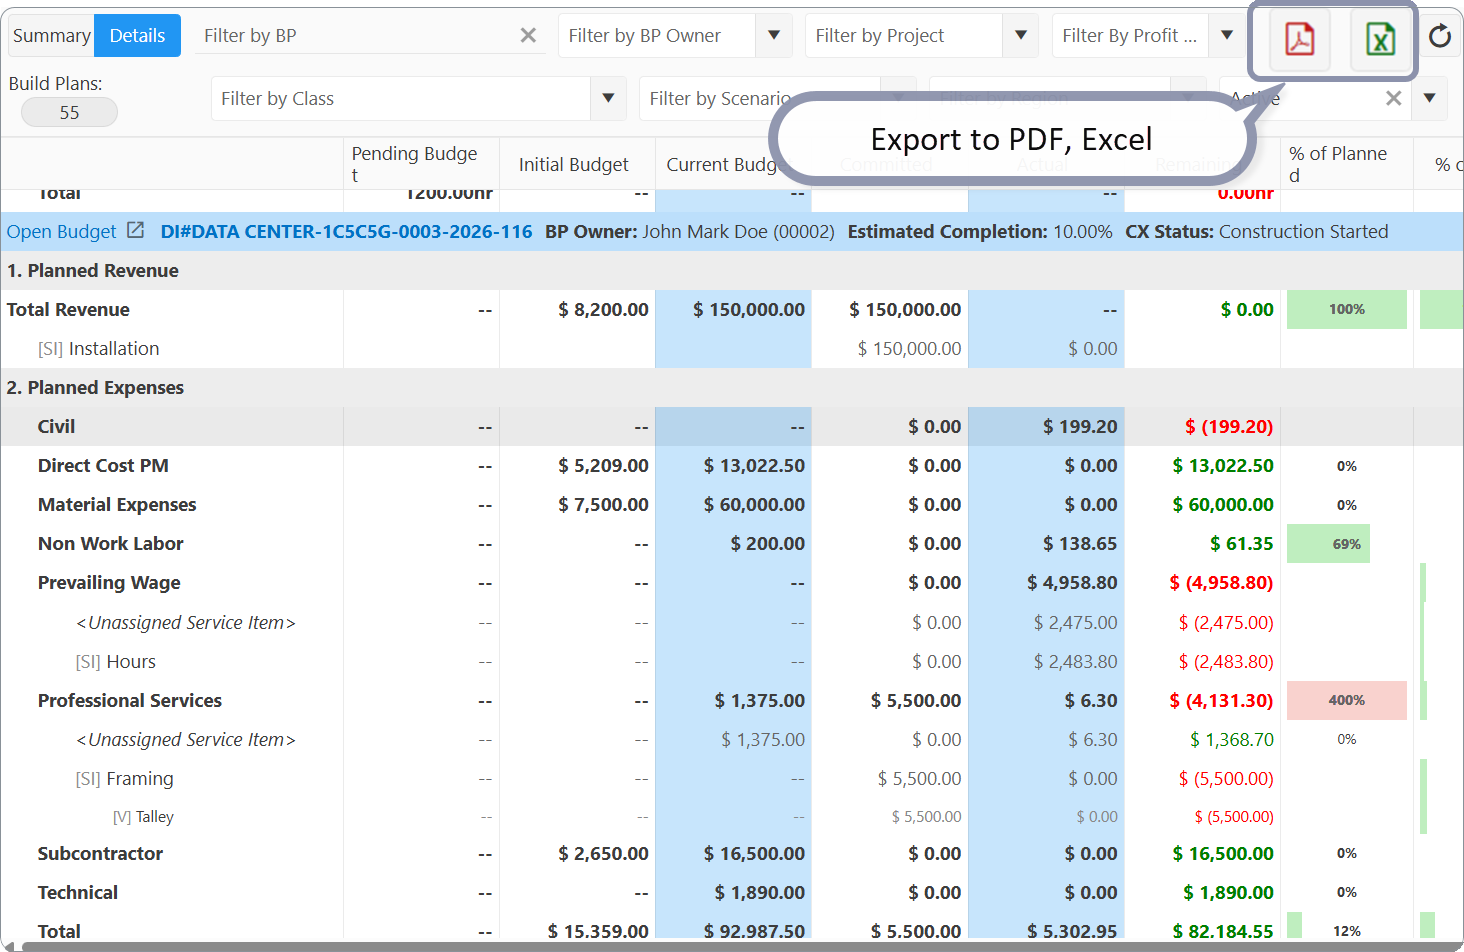
- Excel export on Details for spreadsheet analysis
- Print layout available from the dashboard toolbar (where enabled)
Q&A
Q: Why does Summary show only closed Build Plans?
A: Summary compares finalized monthly performance. For active Build Plans, use the Details tab or the Build Plan Current Budget tab.
Q: How is Variance (%) calculated?
A: Variance ($) divided by Total Projected Spend ($), multiplied by 100.
Q: Can I see pending budget amounts on the dashboard?
A: Yes. The Pending Budget column on Details reflects the single pending revision per Build Plan, if one exists.
Q: Does the dashboard include Build Plans without a budget?
A: Build Plans without an approved budget still appear when you have access, but planned columns may be empty. WIP on those Build Plans may use system WIP percentage settings instead of budget-based completion.
Related articles
- Monitor Build Plan Budget — column and formula reference for the Details grid
- Build Plan Budgets — create and edit budgets
- Build Plan Budget Approval — approval workflow
Was this article helpful?
That’s Great!
Thank you for your feedback
Sorry! We couldn't be helpful
Thank you for your feedback
Feedback sent
We appreciate your effort and will try to fix the article